by
Joel Karlin
,
DTN Contributing Analyst
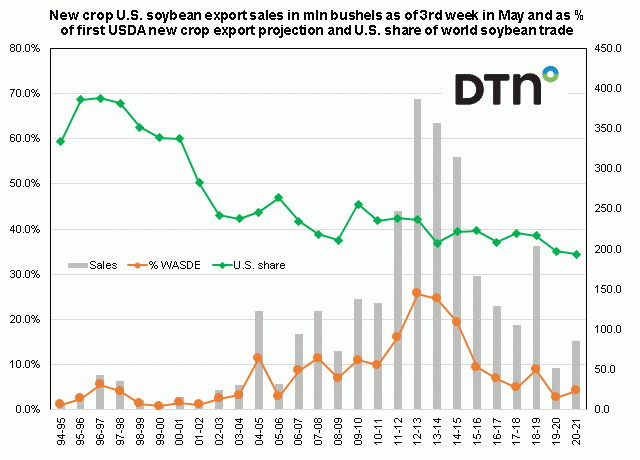
USDA is forecasting US soybean exports at 1.700 billion bushels for this season, the second lowest figure since the 2013-14 season and may soon be the lowest if subsequent WASDE reports reduce this year's exports even more.