Fundamentally Speaking
History of Nov to Jan Corn and Bean Yield Revisions
Among the reports USDA will release January 9 is the annual crop production figures.
Given the increase in corn yield from 173 to 174.9 bushels per acre (bpa) and from 49.6 to 49.9 bpa for soybeans from the October to the November report, there is some talk that a further increase will be seen next month.
We took a quick look to see if this was case in past but over 25 seasons, there were six years when corn yields increased further in January after rising in the November report and six times it was lower.
As for soybeans, since 1999 the USDA increased the soybean yield ten times from the October to the November report and again half the time it further hiked it in the final report and half the time lowered it.
P[L1] D[0x0] M[300x250] OOP[F] ADUNIT[] T[]
We then looked at the magnitude of the change from the November to the January report and how it compared to how the final yield itself deviated from the trend calculation.
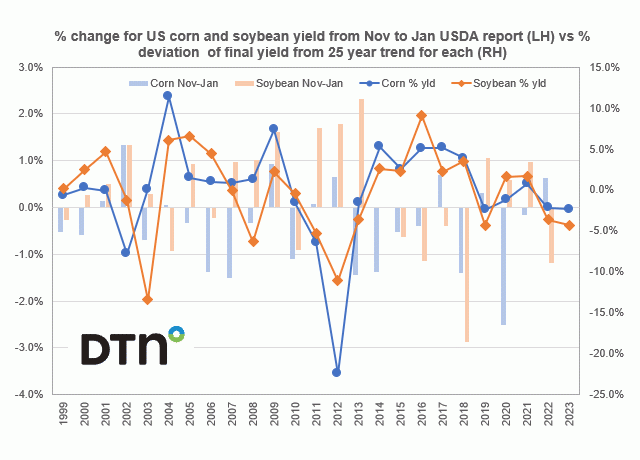
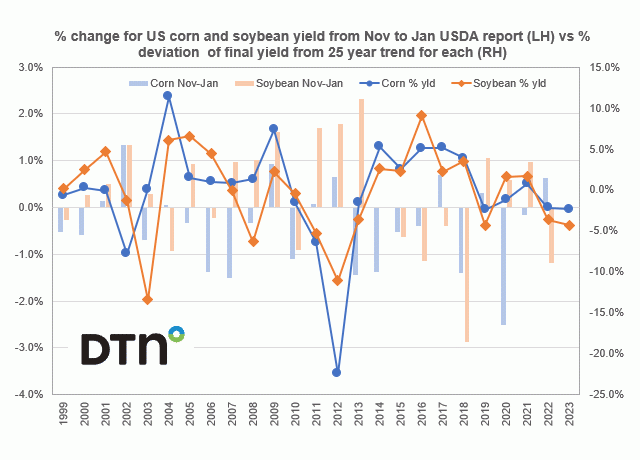
This chart shows the percent change for the U.S. corn and soybean yield from the November to the January report on the left-hand axis while reported on the right-hand axis is the percent the final yield deviated from the 25-year trend for each.
Last year USDA also increased the corn yield from the October to November report by 0.4 bpa and then popped it up another 1.1 bpa or 0.6% in the final report.
However for soybeans, while USDA also increased the yield from the October to November report by 0.4 bpa, it then lowered it by 0.6 bpa in January.
That 1.2% decline, other than the 1.5 bpa drop in 2018 (down 2.9%), is the second largest percent soybean yield drop from the November to January crop report at least since 1999.
The largest Nov to Jan corn decline over the past 25 years came in 2020 of down 2.5%, or 2.6 bpa.
Since 1999 the USDA has lowered the corn yield from the November to the January report by an average of 0.4% and increased it for soybeans by 0.3%.
We should also mention that USDA November corn and soybean yield projections are off 2.3% and 4.3% from their respective 25-year trend figures.
(c) Copyright 2023 DTN, LLC. All rights reserved.


Comments
To comment, please Log In or Join our Community .