Fundamentally Speaking
New Elevated SX/CZ Price Ratio
Not too many fireworks in last week's WASDE figures but there will be a slew of reports out January 9 including the quarterly grain on and off farm stocks as of December 1 and the final 2023 crop production of the year.
In the January WASDE report based on the 12/1 stocks and final crop report, USDA will be better able to determine what usage was in Sep-Nov period.
Seeing some talk that final 2023 corn and bean yields could be above the 174.9 bushels per acre (bpa) for corn and 49.9 bpa soybean estimates given in the November crop production report after the USDA increased each the prior month by 1.9 and 0.3 bpa respectively.
P[L1] D[0x0] M[300x250] OOP[F] ADUNIT[] T[]
Assuming no demand change, this could increase the U.S. corn carryout above what already is an ample ending stocks figure and perhaps add to what is a historically tight soybean one.
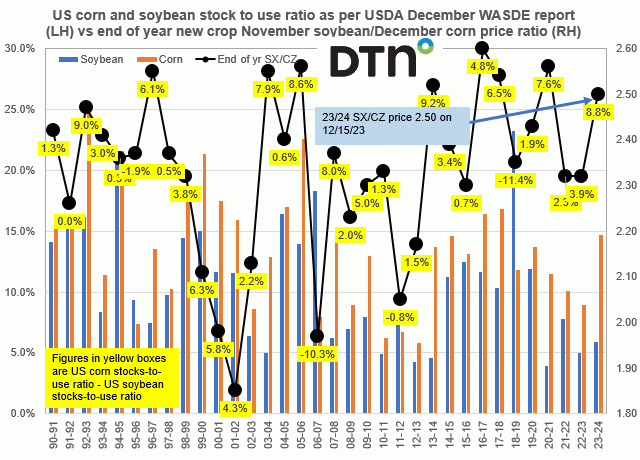
This graphic shows the U.S. corn and soybean stocks-to-use ratios seen in the December WASDE report from the 1990-91 season to the figures furnished last week plotted on the left-hand axis while reported on the right-hand axis is the end of the year new crop November soybean/December corn price ratio (with the exception of this year where the SX/CZ price is from 12/15/23).
The figures in the yellow boxes are the U.S. corn stocks-to-use ratio minus the U.S. soybean stocks-to-use ratio. The current soybean stocks-to-use ratio at 5.9% is the third lowest in ten years and well below the 30-year average of 10.8%.
As for corn, the current stocks-to-use ratio at 14.7% is the highest since the 2017/18 season and above the 30-year average of 13.6% and is the third highest stocks-to-use ratio as of the December WASDE since 2005.
Interesting to note that the 8.8% difference between the two stocks-to-use ratios is the highest positive differential in favor of corn since the 2013/14 season suggesting a very comfortable corn situation vis-à-vis that soybeans.
This feeds into talk that U.S. farmers will switch some corn acreage to soybeans and the current 2.50 November soybean/December corn ratio above the long-term average in favor of beans.
Other years of higher positive corn differentials regarding stocks-to-use ratios such as 2003/04, 2005/06 and 2013/14 also had very high end of year SX/CZ ratios while seasons of higher soybean stocks-to-use ratios vs corn had much lower end of year SX/CZ ratios.
(c) Copyright 2023 DTN, LLC. All rights reserved.


Comments
To comment, please Log In or Join our Community .