October 2023-March 2024 total precipitation as a percent of the average 1896-2024 October-March figure for the top 21 corn and soybean producing states vs. end of March Palmer Drought Severity Index (PDSI)
Percent of total corn and soybean stocks held on-farm vs. the total 3/1 corn and soybeans stocks as a percent of the prior year
This week, in its first national winter wheat condition report of the spring, USDA showed 56% of the crop in good-to-excellent condition, which is double the 30% of a year ago.
End of March December corn price along with the 2007-2024 end of March average Dec price of $4.76 vs. the end of March November soybean price along with the 2007-2024 end of March average Nov price of $11.15
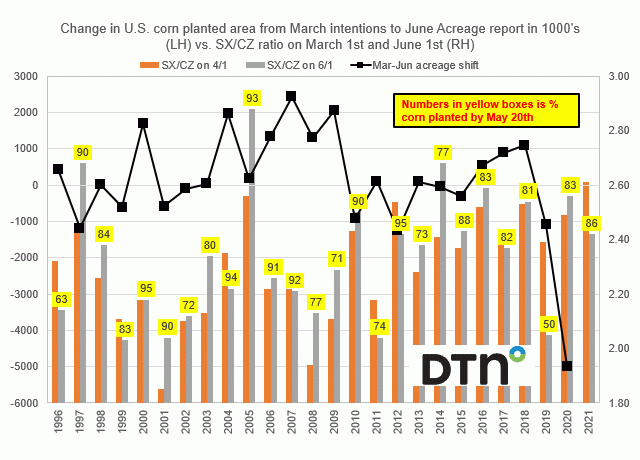
Percent of U.S. corn planted by April 30 and May 25 vs. acreage change for corn and soybeans from March intentions to the final figure
average percent change in U.S. soybean planted area from the March intentions to June acreage report, the June acreage to the final production figure, and also the March intentions to the final number for the top 18 producing states and the U.S.
Percent change in U.S. soybean planted area from the March intentions to June acreage report, the June acreage to the final production figure and the March intentions to the final number.
Change in the November soybean/December corn ratio from Jan 1 to Feb 1, Feb 1 to Mar 1 and Mar 1 to Apr 1 vs. the SX/CZ ratio as of Mar 1.
10- and 20-year average percent changes in planted soybean acreage for the top 18 growing states and the U.S. from the March intentions to the June acreage reports and then the June Acreage figures until the final production report numbers.
USDA Ag Outlook U.S. wheat yield projection and final figure vs. the USDA Ag Outlook wheat harvested to planted acreage ratio projection and final figure
Grain and oilseed markets continue to spiral lower save for a short-covering rally here or there such as we saw Tuesday after the long holiday weekend.
Percent change between the USDA Ag Outlook projections for corn and the final estimates for food-seed-industrial usage (FSI), feed utilization, planted area and yield vs. the percent differences for exports and average farm price.
Change in the February WASDE U.S. ending corn, soybean, and wheat stocks from what was estimated a year earlier at their Feb USDA Ag Outlook and the percent change.
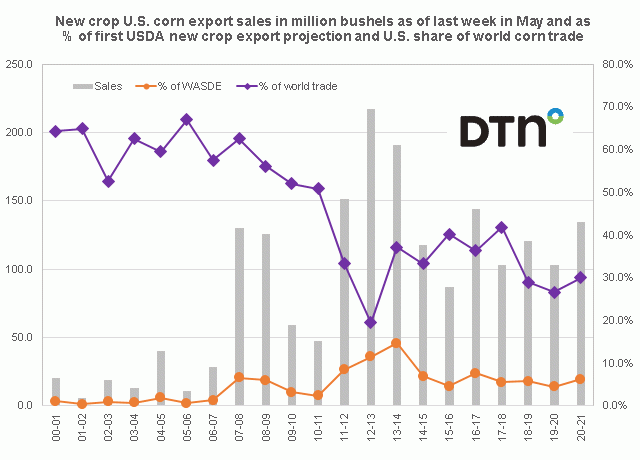
U.S. corn export sales and shipments as of the first week of February and those figures as a percent of the February WASDE projection
Percent change in spot corn, soybeans, and Chicago wheat for the month of January from 2000 to 2024 vs. percent change vs. the year ago level as of the end of January.
November soybean/December corn price ratio as of January 26 vs the percent acreage chance for both corn and soybeans from the prior's year's final acreage figures to the following planted area projections given in the end of March USDA Prospective Plantings report
Final 2023 and projected 20-year trend for corn in bushels per acre vs. the slope of the 2004-2023 trend yield
End of December 2022, April 2023, August 2023, and December 2023 PDSI readings for the top corn and soybean growing states and the U.S. vs. the rank of the states' end of December 2023 PDSI reading
DIM[2x3] LBL[blogs-fundamentally-speaking-list] SEL[[data-native-ad-target=articleList]] IDX[2] TMPL[news] T[]
DIM[2x3] LBL[blogs-fundamentally-speaking-list-2] SEL[[data-native-ad-target=articleList]] IDX[5] TMPL[news] T[]