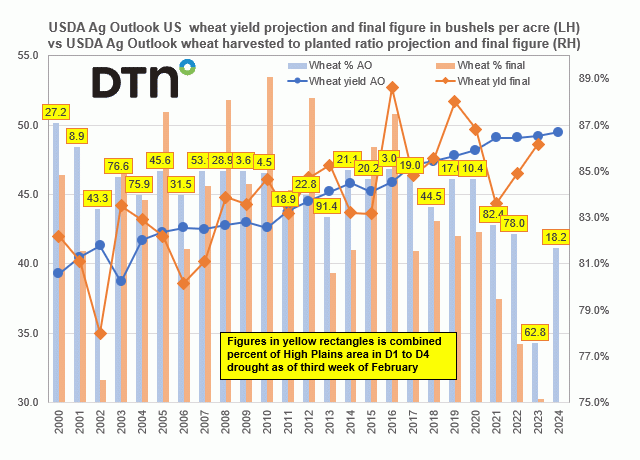
USDA Ag Outlook U.S. wheat yield projection and final figure vs. the USDA Ag Outlook wheat harvested to planted acreage ratio projection and final figure

USDA Ag Outlook U.S. wheat yield projection and final figure vs. the USDA Ag Outlook wheat harvested to planted acreage ratio projection and final figure
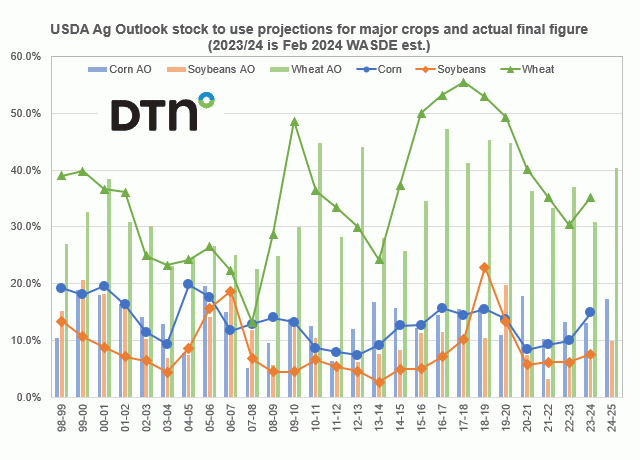
Grain and oilseed markets continue to spiral lower save for a short-covering rally here or there such as we saw Tuesday after the long holiday weekend.

Grain and oilseed markets continue to spiral lower save for a short-covering rally here or there such as we saw Tuesday after the long holiday weekend.
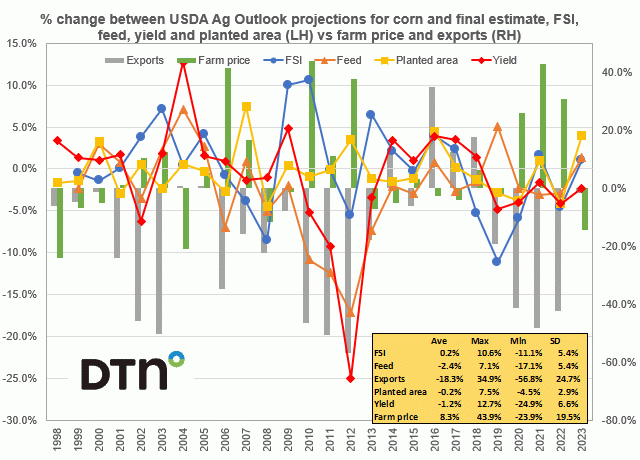
Percent change between the USDA Ag Outlook projections for corn and the final estimates for food-seed-industrial usage (FSI), feed utilization, planted area and yield vs. the percent differences for exports and average farm price.
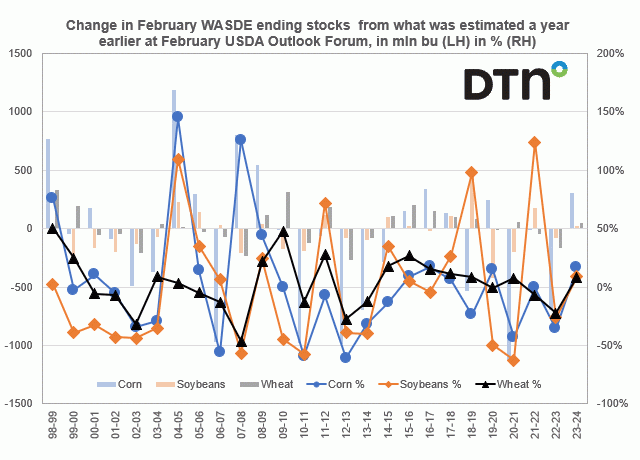
Change in the February WASDE U.S. ending corn, soybean, and wheat stocks from what was estimated a year earlier at their Feb USDA Ag Outlook and the percent change.
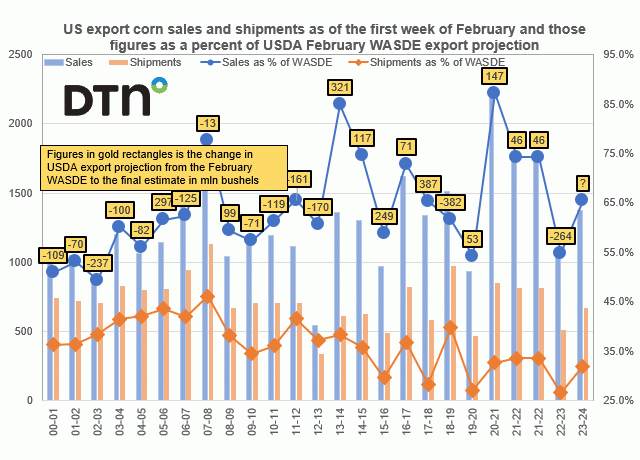
U.S. corn export sales and shipments as of the first week of February and those figures as a percent of the February WASDE projection
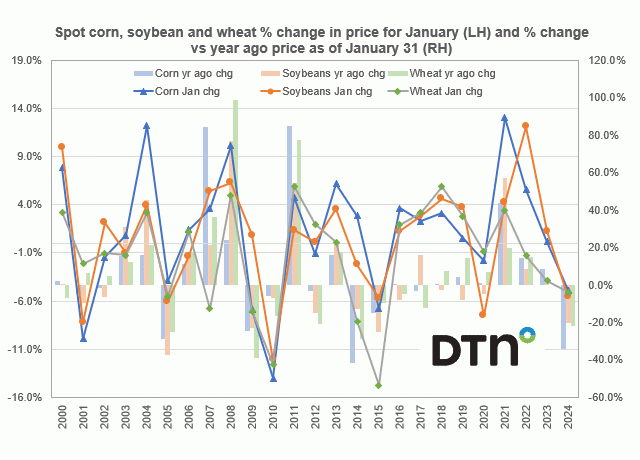
Percent change in spot corn, soybeans, and Chicago wheat for the month of January from 2000 to 2024 vs. percent change vs. the year ago level as of the end of January.
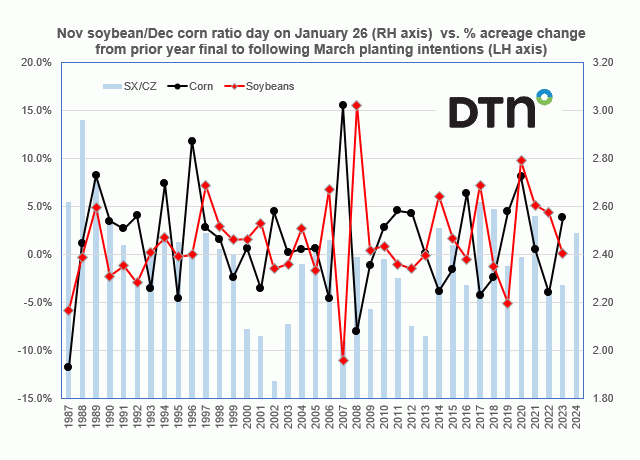
November soybean/December corn price ratio as of January 26 vs the percent acreage chance for both corn and soybeans from the prior's year's final acreage figures to the following planted area projections given in the end of March USDA Prospective Plantings report
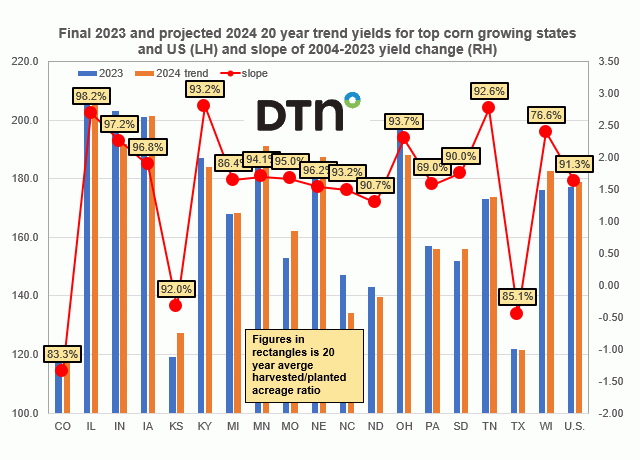
Final 2023 and projected 20-year trend for corn in bushels per acre vs. the slope of the 2004-2023 trend yield
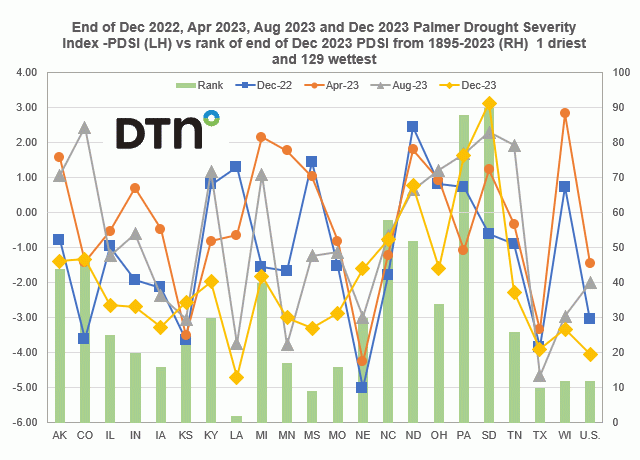
End of December 2022, April 2023, August 2023, and December 2023 PDSI readings for the top corn and soybean growing states and the U.S. vs. the rank of the states' end of December 2023 PDSI reading
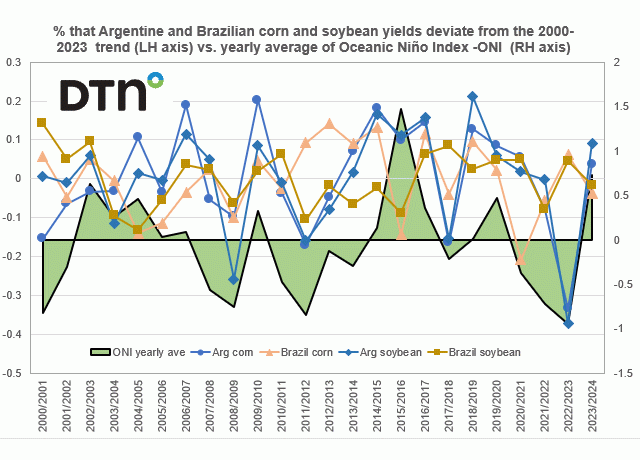
Percent that Argentine and Brazilian corn and soybean yields deviate from the 2000-2023 trend vs. the year average of Oceanic Niño Index (ONI)
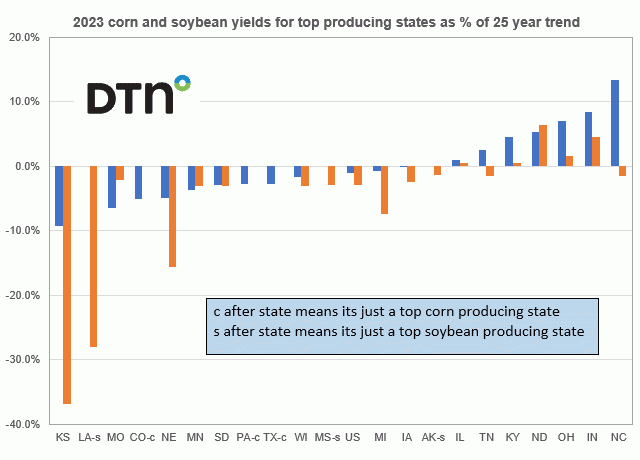
The 2023 corn and soybean yields for the top producing states of each as a percent of the 25-year trend.
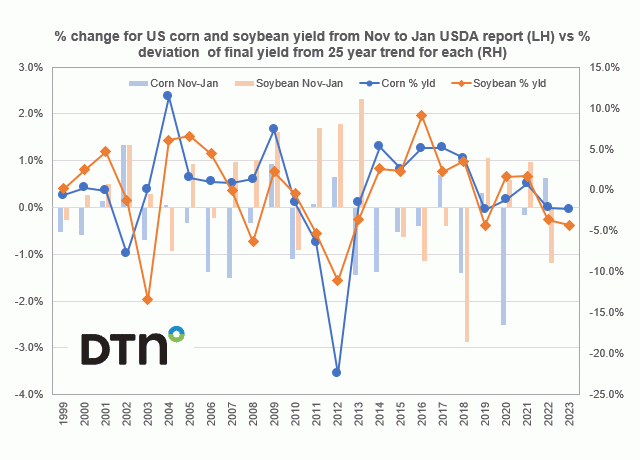
Percent change for the U.S. corn and soybean yield from the November to the January report vs. the percent the final yield deviated from the 25-year trend for each.
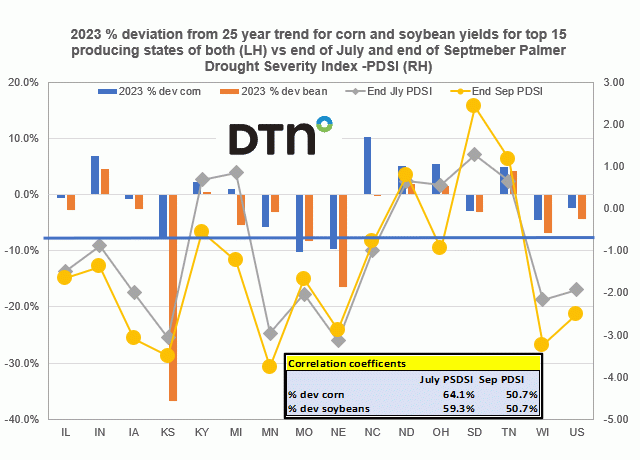
2023 percent deviation from the 25-year trend for corn and soybean yields for the top 15 producing states vs. the end of July and end of September Palmer Drought Severity Index readings
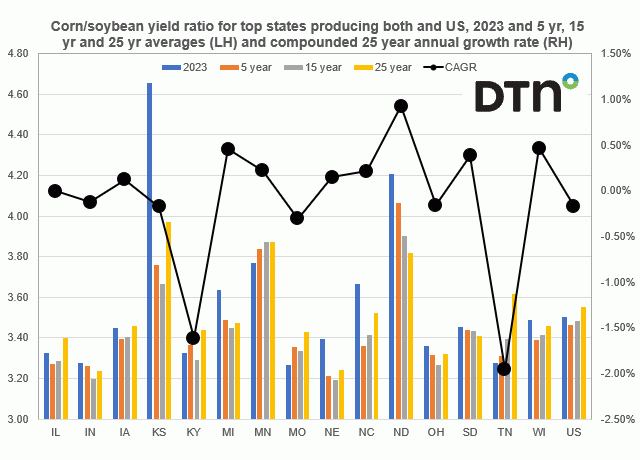
Corn/soybean yield ratios for the top 15 states that produce both and the U.S. for this past season based on the November crop report and their respective five-, 15- and 25-year averages vs. the trend in that ratio for these states
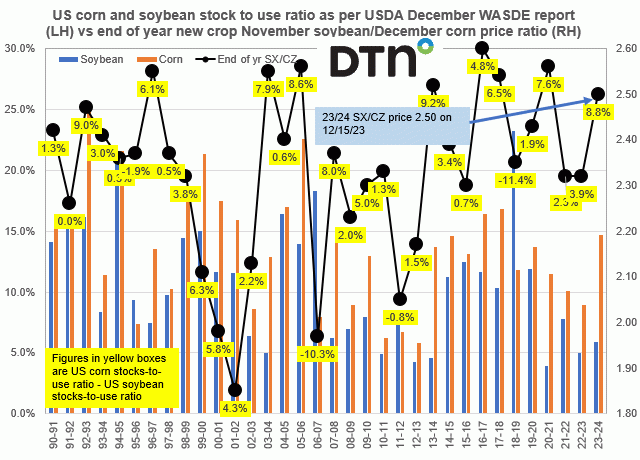
U.S. corn and soybean stocks-to-use ratios seen in the December WASDE report from the 1990-91 season to the figures furnished last week plotted vs. the end of the year new crop November soybean/December corn price ratio
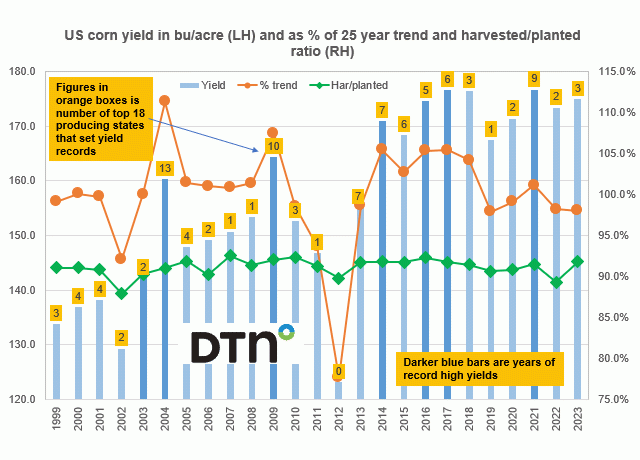
U.S. corn yield vs. both the annual yield as a percent of the 25-year trend and the harvested/planted ratio acreage ratio.
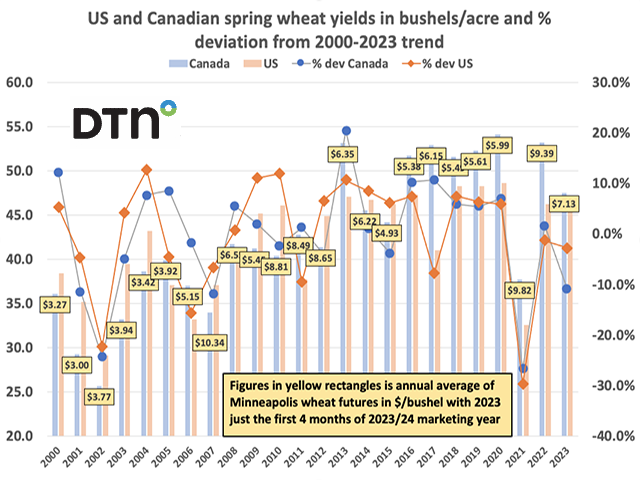
The correlation between U.S. and Canadian wheat yields is over 80%, yet each have a low correlation to Minneapolis spring wheat futures prices.
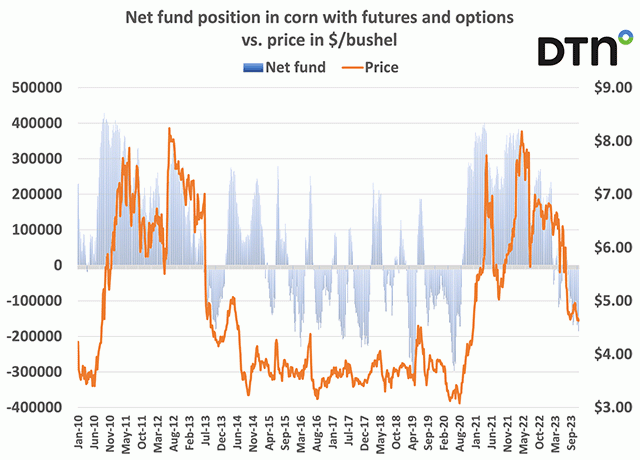
Corn futures are receding, but there are a few situations that could develop that might turn the market around.
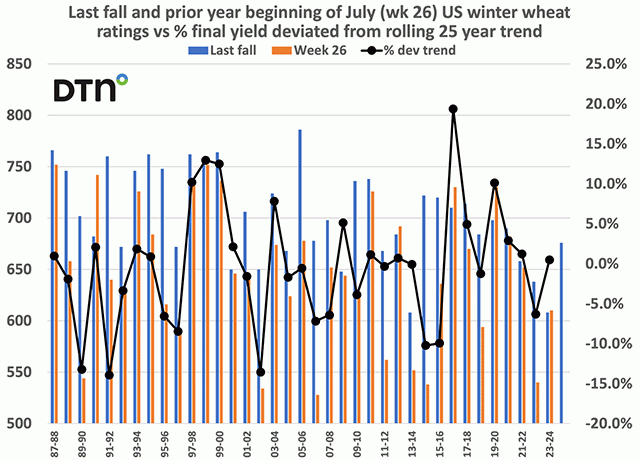
Using 1987-2023 data, the correlation between the final fall wheat condition rating and the percent that the final winter wheat yield deviates from trend is 16.7%, but that jumps to 72.2% by the beginning of July.
DIM[2x3] LBL[blogs-fundamentally-speaking-list] SEL[[data-native-ad-target=articleList]] IDX[2] TMPL[news] T[]
DIM[2x3] LBL[blogs-fundamentally-speaking-list-2] SEL[[data-native-ad-target=articleList]] IDX[5] TMPL[news] T[]