Fundamentally Speaking
Corn/Soybean Yield Ratio Changes
As we near the end of the year, we are seeing a lot of 2023 Review/2024 Preview type of commentaries so it is interesting to read the recent CoBank report about the top eight factors in agriculture to watch for in 2024.
Among those listed was an expansion of soybean acreage for the coming year expected for two reasons.
First is 2023's smaller soybean harvest in the U.S. and an increase in biofuel demand.
They noted that the USDA's early release of its Agricultural Projections to 2033 points to planted soybean acreage rising 4% year on year to 87 million acres this spring.
That seems to be the consensus opinion as U.S. soybean stocks are relatively tighter than those for corn and the current 2.52 November 2024 soybean/December 2024 corn futures ratio seems also to be signaling a need for more soybean as opposed to corn acreage.
Still a way off is the developing South American crops that will have a lot to say about respective corn and soybean prices this spring while Mother Nature will also influence what is actually put in the ground.
P[L1] D[0x0] M[300x250] OOP[F] ADUNIT[] T[]
Of course, farmers have their own opinions of what the proper mix of crops should be, and expectations of yield performance are one of the key considerations.
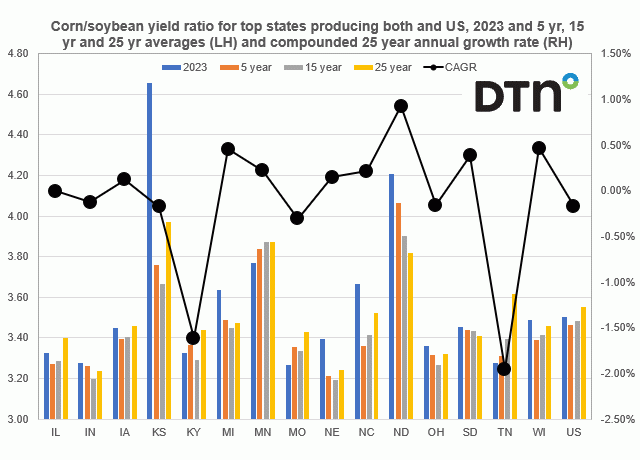
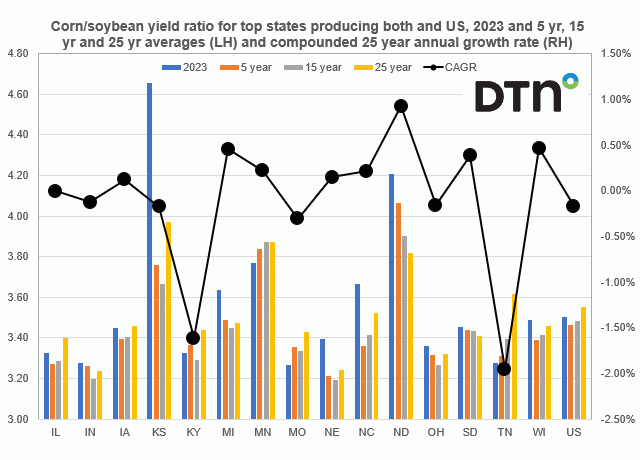
Along these lines, this chart shows the corn/soybean yield ratios for the top 15 states that produce both and the U.S. for this past season based on the November crop report and their respective five-, 15- and 25-year averages plotted on the left-hand axis.
In addition to the ratios, we are curious about the trend in that ratio for these states, so on the right-hand axis is the compounded 25-year annual growth rate.
Some interesting features include looking at those states where the corn/soybean ratio has improved over the year or corn yields increase relative to soybean yields and then the opposite situation where bean yields have improved vis-à-vis soybeans.
Based on just yield as performance, North Dakota is a state where a farmer may be inclined to go with more corn as opposed to soybean acreage.
In ND, the 25-year corn/bean yield ratio is 3.82 but over the past 15 years it has increased to 3.90 and over the past five years even more to 4.06.
Last year the ratio was 4.21 with the states corn yield 5.2% above the 25-year trend and soybeans just 1.9% above trend.
North Dakota's compounded annual increase in the corn/soybean yield ratio of 0.92% is by far the highest of any state.
On the other hand, a state like Tennessee shows the opposite situation where soybean yields there have improved vs. corn over the years and farmers there would seem to be more receptive to the idea of switching more of their corn ground over to soybeans.
Their 25-year corn/bean yield ratio is 3.61 but over the past 15 years it has decreased to 3.39 and over the past five years even more to 3.31.
Last year the ratio was 3.28.
Tennessee has a compounded annual decrease in the corn/soybean yield ratio of down 1.9% as over the past 25 years that state's corn yields, relative to its soybean yields, have fallen more than any other state.
We should note the U.S. also has a similar trend with the 25-year average corn/bean ratio at 3.55 but down to 3.48 over the past 15 years and down to 3.46 over the past five seasons with a CAGR of -0.17%.
(c) Copyright 2023 DTN, LLC. All rights reserved.


Comments
To comment, please Log In or Join our Community .