Fundamentally Speaking
USDA Ag Outlook Projections for Corn
The big news this week is the 100th USDA Ag Outlook Forum and trade is already talking about some of the larger corn and soybean ending stocks likely to be projected in years.
This is based on expected record forecasted yields for each, a large jump in soybean seedings and hefty corn carry-in stocks.
Again, these are early season projections as the first official 2024/25 balance sheets won't be released until the May 2024 WASDE report.
Nonetheless it is always interesting to see how USDA's first stab at S&D numbers match up to what actually transpires.
P[L1] D[0x0] M[300x250] OOP[F] ADUNIT[] T[]
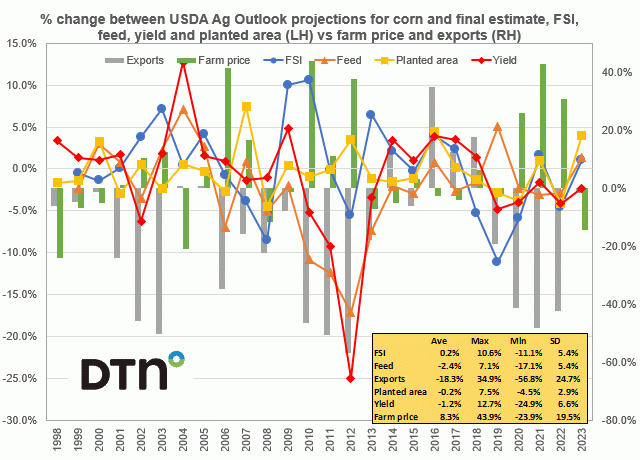
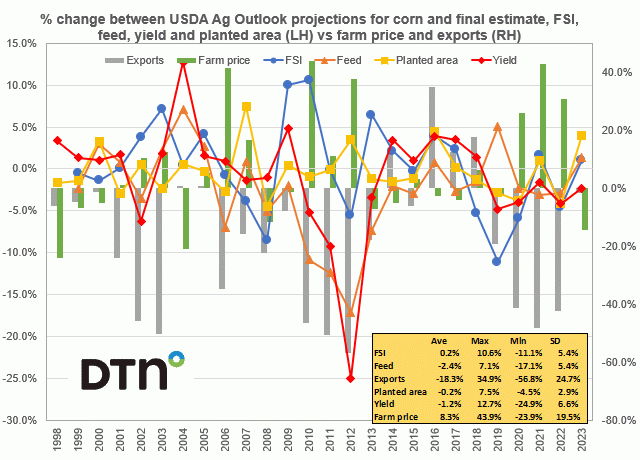
Along these lines, this chart shows the percent change between the USDA Ag Outlook projections for corn and the final estimates for food-seed-industrial usage (FSI), feed utilization, planted area and yield on the left-hand axis while the percent differences for exports and average farm price are plotted on the right-hand axis.
In the rectangle we also report the summary statistics for the period 1998-2023 which includes the average percent differential, the maximum difference, the minimum difference, and the standard deviation of these annual percent changes.
Keep in mind that the Ag Outlook figures are released mid to late February each year, but the final WASDE projections are issued the following November, more than 18 months later, so the situation can change greatly over the marketing year.
Nonetheless it appears that pegging domestic demand has the greatest accuracy as final FSI usage has averaged just 0.2% over what USDA projects at the Ag Outlook and the standard deviation is quite low at 5.4%.
This is also the standard deviation of the feed estimate which tends to average 2.4% below what USDA projects at the Ag Forum.
The planted area projections are also usually close to the mark averaging 0.2% below what USDA projects at the Ag Forum with the lowest standard deviation of 2.9%.
Given the uncertainty of weather during the growing season we found it somewhat surprising that the final yield averages are just 1.2% below the Ag Outlook projection with a standard deviation of 6.6%.
The biggest challenge appears to be projecting exports as the final figure averages 18.3% below the Ag Outlook projection with a standard deviation of 24.7% while the average farm price tends to be 8.3% higher than what is forecast 18 months earlier with the second highest standard deviation of 19.5%.
As for this year's projections, the most interesting detail is 2023 planted area at 94.64 million acres, 4.0% above the year ago Ag Outlook forecast of a 91 million acre corn planted area, the third largest miss since projections started back in the 1998/99 season.
(c) Copyright 2024 DTN, LLC. All rights reserved.


Comments
To comment, please Log In or Join our Community .