Fundamentally Speaking
Worsening Drought Readings Weigh on Soybeans
It's a rather quiet time in markets as we are nearing year-end.
Attention is focused on grain transport woes throughout the world and developments with regard to the South American crops.
After the turn of the year however, trade will gear up for a slew of USDA reports on January 9 including the annual crop production report where we will get final tally on 2023 U.S. corn and soybean yields.
It wasn't the best of growing seasons but it wasn't among the worst as given rather stressful conditions throughout the summer, USDA November figures of 174.9 bushel per acre (bpa) yield for corn and 49.9 bpa for soybeans is probably higher than many would have thought at the end of August.
P[L1] D[0x0] M[300x250] OOP[F] ADUNIT[] T[]
It is interesting to see which states did better than others and perhaps examine why this is so.
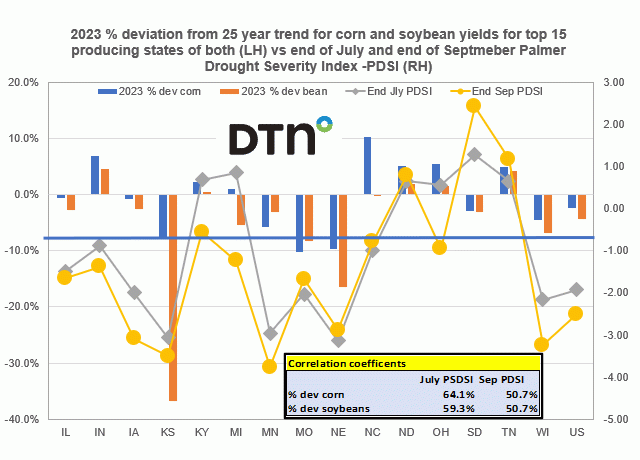
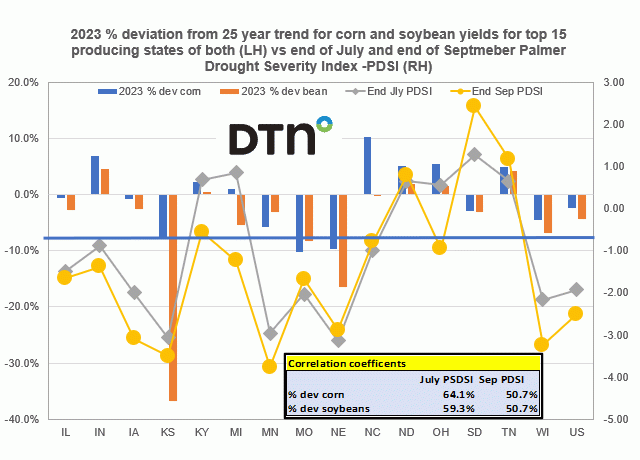
This chart shows the 2023 percent deviation from the 25-year trend for corn and soybean yields for the top 15 producing states of each and that data is plotted on the left-hand axis.
Reported on the right-hand axis is the end of July and end of September Palmer Drought Severity Index readings (PDSI) for each of those states.
Within the graph is a box showing the correction coefficients between the July and Sep PDSI readings and the percent deviation from trend for both corn and soybeans.
Note the biggest deviation from trend was this past season's Kansas bean yield at 26 bpa which was a sharp 36.8% below trend, yet their corn yield was only 7.8% below trend.
Of course, Kansas was in a severe drought all season with an end of Sep PDSI at -3.50 which was worse than the end of July reading at -3.07.
Perhaps the fact that dryness was worse later in the season is the reason why bean yields, whose critical developmental period occurs after corn, were lower than corn yields.
Interesting to note that in addition to Kansas with the sole exception of MN, this also the case in IL, IN, IA, KY, MI, OH, WI and US when Sep PDSI readings were lower than the end of July figures soybean yields were lower than corn yields on a percent deviation from trend basis.
It goes without saying that those states that were not in any drought or had PSDI readings at -1.00 or higher generally had trend or higher yields.
(c) Copyright 2023 DTN, LLC. All rights reserved.


Comments
To comment, please Log In or Join our Community .