Fundamentally Speaking
Many Key Corn Belt States Still Show Very Dry Soil
As we have noted in prior blog pieces, 2024, similar to other recent seasons, has been quite warm in the U.S. so far this year as indicated by NOAA in its latest report Assessing the U.S. Climate in March 2024.
The average temperature of the U.S. in March was 45.1 F, 3.6 F above average, ranking 17th warmest in the 130-year record as temperatures were above average across much of the contiguous U.S. For January-March, the average contiguous U.S. temperature was 39.4 F, 4.2 F above average, ranking fifth warmest on record for this period.
Temperatures were above average across most of the contiguous U.S., while record-warm temperatures were observed in parts of the Northeast.
Wisconsin, Michigan, New York, Vermont, New Hampshire, and Maine each ranked second warmest for the January-March period.
As for moisture, March precipitation for the contiguous U.S. was 2.85 inches, 0.34 inch above average, ranking in the wettest third of the historical record.
P[L1] D[0x0] M[300x250] OOP[F] ADUNIT[] T[]
Precipitation was above average across much of the West, in the Great Lakes and along the Gulf and East coasts and in parts of the Northern Plains.
The January-March precipitation total for the contiguous U.S. was 8.15 inches, 1.19 inches above average, ranking 10th wettest in the 130-year record as precipitation was above average across much of the contiguous U.S.
The above average temperatures and decent precipitation over the past three months is seen leading to a quicker than normal start for the nation's corn and soybean producers, though soils in some of the western states remain dry, while those further east more saturated due to heavy storms over the past two weeks.
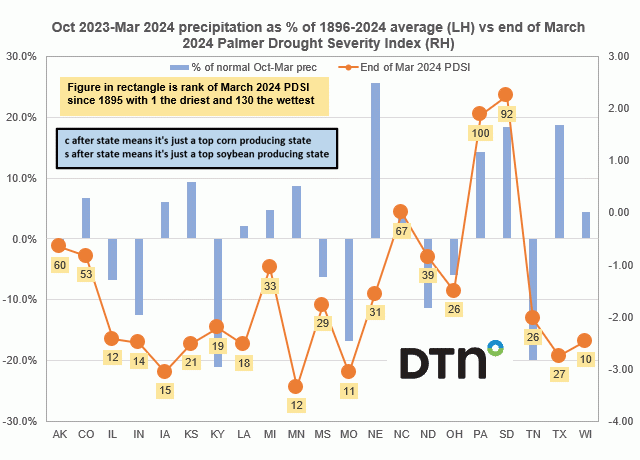
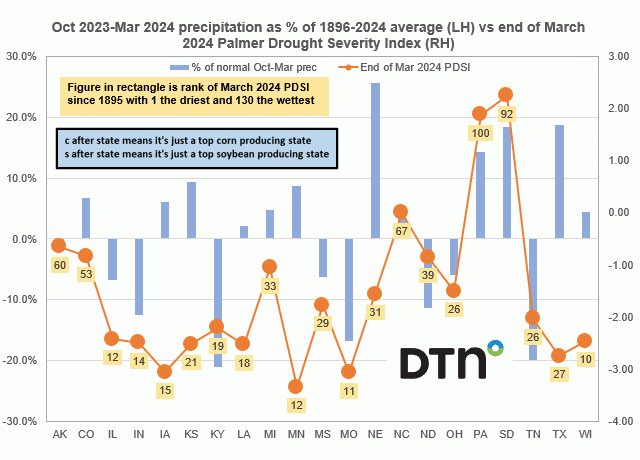
Along these lines this chart shows the October 2023-March 2024 total precipitation as a percent of the average 1896-2024 October-March figure for the top 21 corn and soybean producing states on the left hand-axis.
Reported on the right hand-hand axis is the end of March Palmer Drought Severity Index (PDSI) which is the monthly value that is generated indicating the severity of a wet or dry spell.
This index generally ranges from -6 to +6, with negative values denoting dry spells and positive values indicating wet spells.
The figures in the rectangles are the rank of March 2024 PDSI since 1895 with 1 the driest and 130 the wettest.
Seeing about half the states having above average Oct-Mar total precipitation and half below.
Nebraska had total moisture 25.7% above average while of the top 21 corn and soybean states, Kentucky saw Oct 2023-Mar 2024 total precipitation 21% below average.
Still almost all the states were somewhat dry as only PA and SD have positive PDSI readings with many key Corn Belt states having some of their lowest end of March PDSI readings ever including IL, IN, IA MN, MO and WI.
(c) Copyright 2024 DTN, LLC. All rights reserved.


Comments
To comment, please Log In or Join our Community .