Fundamentally Speaking
Yields of Top Soybean States Relative to US
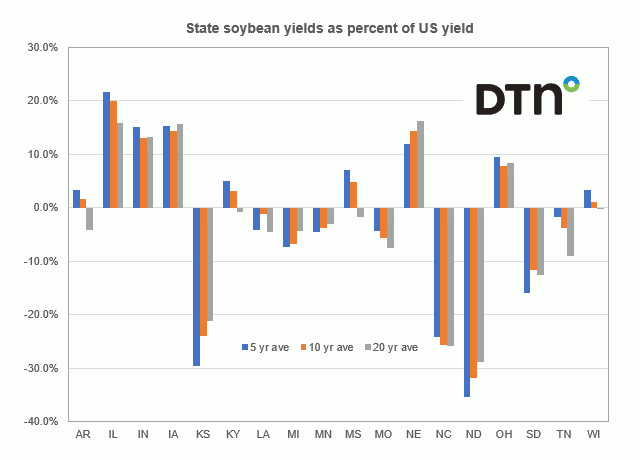
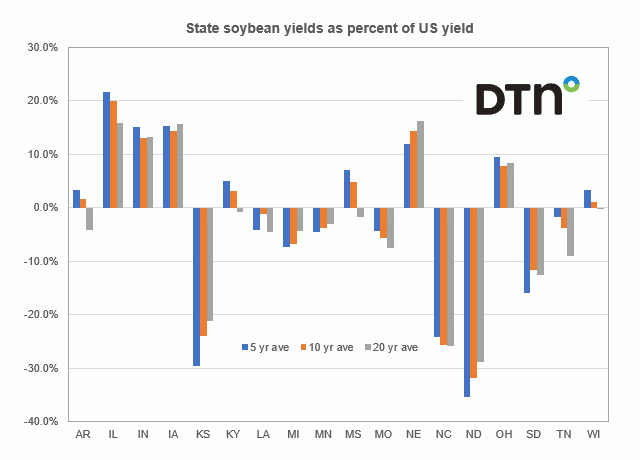
Similar to what we did with corn last week, this chart shows the state yields of the top 18 soybean producing states as a percent of the U.S. yield looking at the twenty, ten and then five-year averages.
While corn has six states that have yields consistently above the U.S. yield, soybeans only have five which include IL, IN, IA, NE and OH but not Minnesota which is included in the corn count.
The best yields are seen in Illinois where over the past five years their soybean yields have averaged 21.7% above the U.S. yield.
P[L1] D[0x0] M[300x250] OOP[F] ADUNIT[] T[]
This is even higher than the ten-year average of 20.0% better and the 20-year average of 15.9% better so IL yields have improved relative to the rest of the country.
The same pattern is seen in KY, MS and WI, but to a lesser extent.
On the other hand, yields relative to the U.S. have gotten progressively worse in a state like North Dakota where the five-year average is a whopping 35.3% below the U.S. yields, and lower than the ten-year average of down 31.7% and the 20-year average of down just 28.9%.
Other states showing a similar pattern where recent yields compared to the U.S. yield have declined over the years include KS, MI and MN.
We also note that though Nebraska soybean yields are above the U.S. average that have got progressively worse over the years as this state along with others in the Plains area have been subject to drought conditions for a number of years.
This is no small consideration as soybean acreage in areas outside the "core" Midwest area have increased over the years so the lower yields in some of the Plains, Delta, and Southeast regions are no doubt contributing to what many see as the plateauing of national soybean yields in recent seasons.
(c) Copyright 2024 DTN, LLC. All rights reserved.


Comments
To comment, please Log In or Join our Community .