Fundamentally Speaking
Farmers Holding Highest Percent of 3/1 Corn, Soybean Stocks in Years
Last week May corn futures finished around eight cents lower, the first lower weekly close in six weeks.
Those that are bullish corn certainly had to be disappointed with action the first week of April especially considering the USDA 3/28 reports.
There the March seeding intentions showed 1.8 million less acres planted than thought and 3/1 quarterly stocks came in well below expectations as one could say 400 million bushels (mb) came off 2024/35 balance sheet with lower output and smaller beginning stocks.
On the other hand, we have to say trade thinking March intentions of 90 million acres will be lowest of the year with June's number figuring to be higher assuming plantings get off to a normal start.
P[L1] D[0x0] M[300x250] OOP[F] ADUNIT[] T[]
Second, ending stocks this year will still be the highest in five years and 50% above the prior season.
USDA is looking for a record yield and if we can produce a 177.3 bushels per acre (bpa) record yield last year when summer weather was far from perfect, that assumption seems reasonable.
As for soybeans, the intentions numbers showed three million more bean acres to be planted than a year ago, meaning around 150 million more beans produced this year than last.
Even if demand increases for the 2024-25 season, it won't be by 150 million acres, so a sizable build seen in the coming year ending stocks that should result in lower prices come fall.
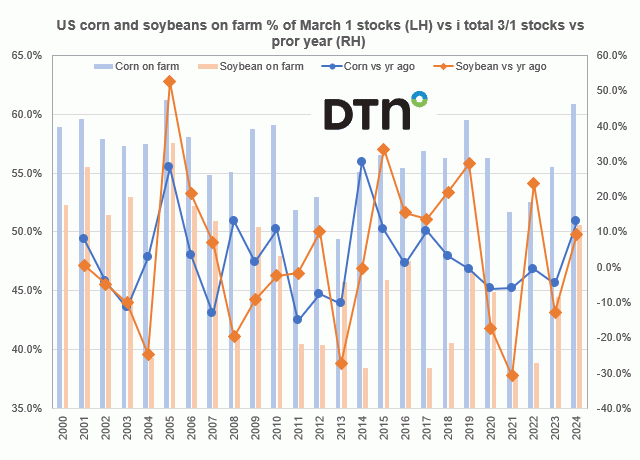
As for the March 1 stocks figures, this chart shows the percent of total corn and soybean stocks held on-farm on the left-hand axis while reported on the right-hand axis is the total 3/1 corn and soybeans stocks as a percent of the prior year with data going back to the 2000 season.
As noted, the 8.347 billion bushels (bb) of corn stocks as of March 1, although 100 mb less than what the trade anticipated, is still the highest amount since March 1, 2019, and the 5.079 bb held on farm 60.8% is the highest since 2000 with exception of 61.2% back in 2005.
These stocks are also 12.9% above the year ago figure, the highest in that regard since 2014.
March 1 total soybean stocks at 1.845 bb is almost exactly what trade was looking for, though here also farmer holdings are very high at 50.6% of that, the loftiest percent since 2007.
Total soybean stocks are also 9.4% above last year.
The point is despite some end of March USDA data that on the surface seemed friendly for corn, it has to be seen in context that corn stocks are still the largest in five years with a huge amount held by producers adding credence to thoughts that any sort of rally attempt should uncover sizable farmer sales both for last years and this year's crops.
(c) Copyright 2024 DTN, LLC. All rights reserved.


Comments
To comment, please Log In or Join our Community .