Fundamentally Speaking
Average Soybean Planted Area Changes
As we head into next week's key Prospective Plantings report, a piece we did earlier this week noted that soybean acreage can vary quite a bit from what the March intentions figures show.
As evidence, for the past five years in a row, the U.S. soybean planted area figure has been lower in the final production report than what was indicated at the end of March with three of those years by huge margins.
P[L1] D[0x0] M[300x250] OOP[F] ADUNIT[] T[]
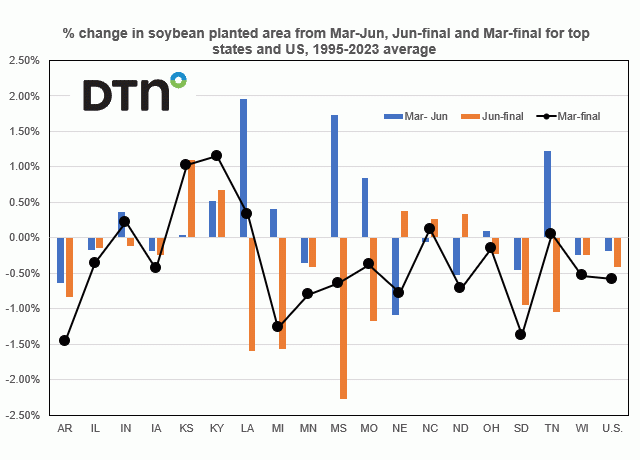
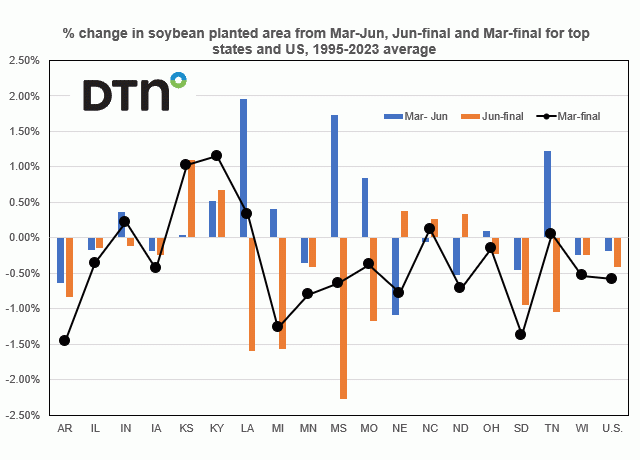
Along these lines, this chart shows the average percent change in U.S. soybean planted area from the March intentions to June acreage report, the June acreage to the final production figure, and also the March intentions to the final number for the top 18 producing states and the U.S. for the period 1995-2023.
We start off by noting that only six of the 18 states on average see soybean planted acreage increase from the March intentions to the final production report including IN, KS, KY, NC and TN with only Kansas and Kentucky showing upward change of any significant degree over 1.0%.
With the exception of Arkansas, all the states that on average see acreage declines from the March intentions to the June acreage area are mostly northerly states where often a cold and wet spring can result in some intended bean area not getting in the ground and this includes IA, MN, NE, ND, SD and WI.
For some reason, Arkansas is also one of the states that sees the largest average acreage declines from the prospective plantings report to the final figures along with Michigan and South Dakota with those two being more understandable in terms of weather.
(c) Copyright 2024 DTN, LLC. All rights reserved.


Comments
To comment, please Log In or Join our Community .