by
Joel Karlin
,
DTN Contributing Analyst
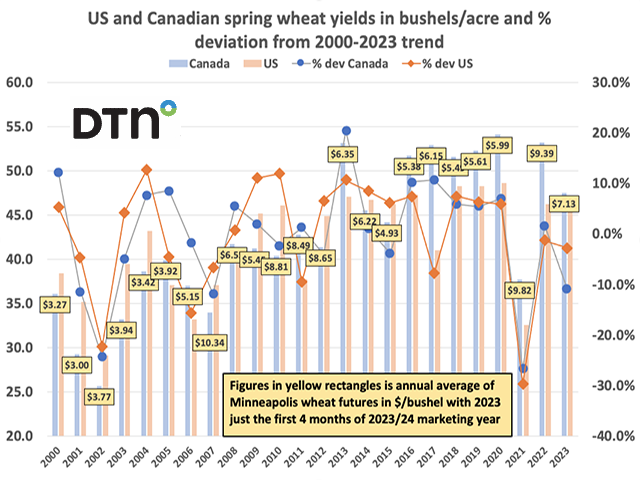
USDA Ag Outlook U.S. wheat yield projection and final figure vs. the USDA Ag Outlook wheat harvested to planted acreage ratio projection and final figure