by
Joel Karlin
,
DTN Contributing Analyst
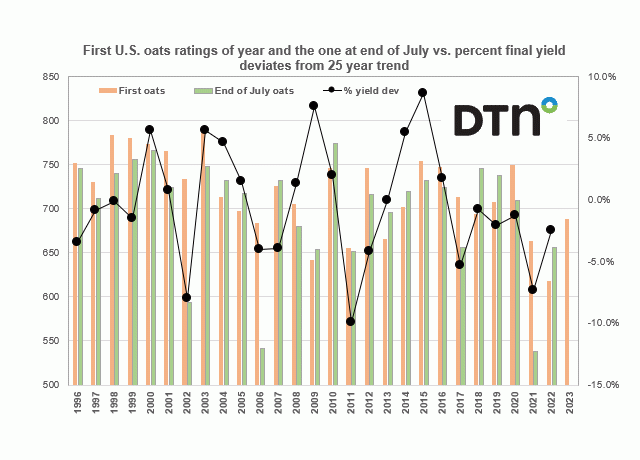
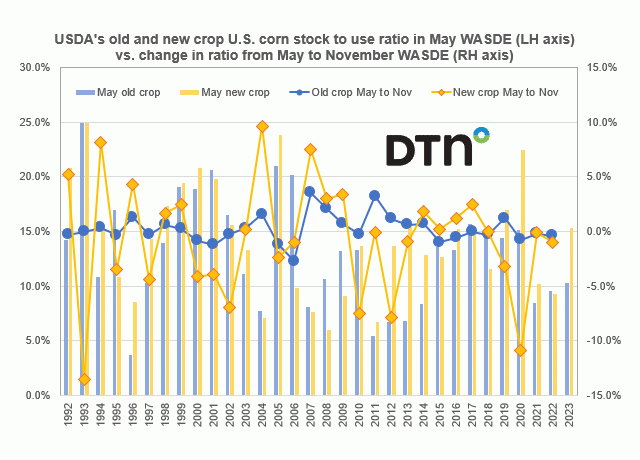
USDA's old and new crop U.S. corn stocks-to-use ratios in the May WASDE report vs. the change in both the old and new crop U.S. corn stocks-to-use ratios from the May to November WASDE reports