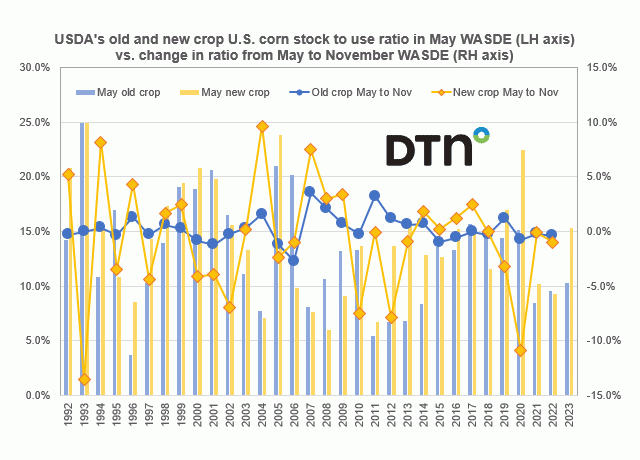
USDA's old and new crop U.S. corn stocks-to-use ratios in the May WASDE report vs. the change in both the old and new crop U.S. corn stocks-to-use ratios from the May to November WASDE reports

USDA's old and new crop U.S. corn stocks-to-use ratios in the May WASDE report vs. the change in both the old and new crop U.S. corn stocks-to-use ratios from the May to November WASDE reports

USDA's old and new crop U.S. corn stocks-to-use ratios in the May WASDE report vs. the change in both the old and new crop U.S. corn stocks-to-use ratios from the May to November WASDE reports
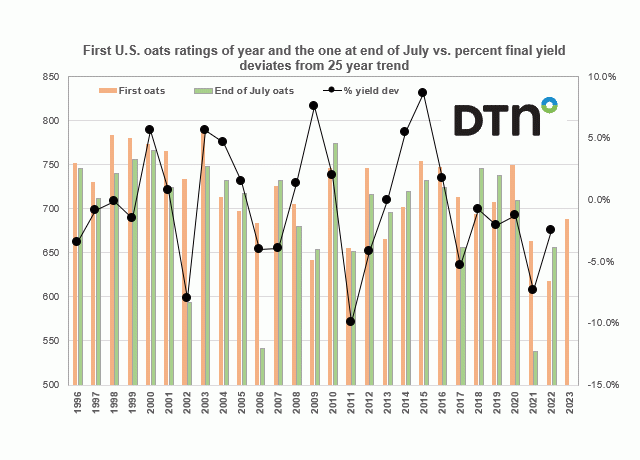
First oat crop rating of each year from 1996 to 2023 along with the rating seen the last week of July vs. the percent that the final oat yield of each season deviated from the 25-year trend.
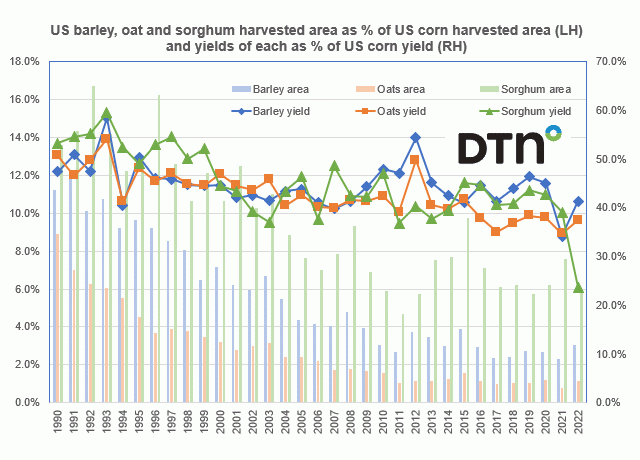
U.S. barley, oat and sorghum harvested area as a percent of the U.S. corn harvested area vs. yields of each of the other feed grains as a percent of the of the U.S. corn yield
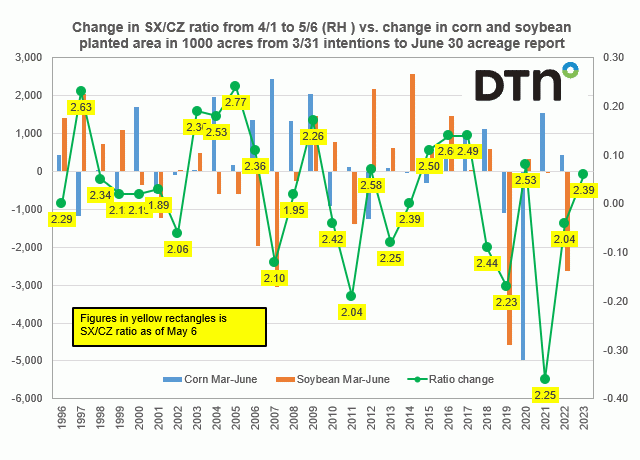
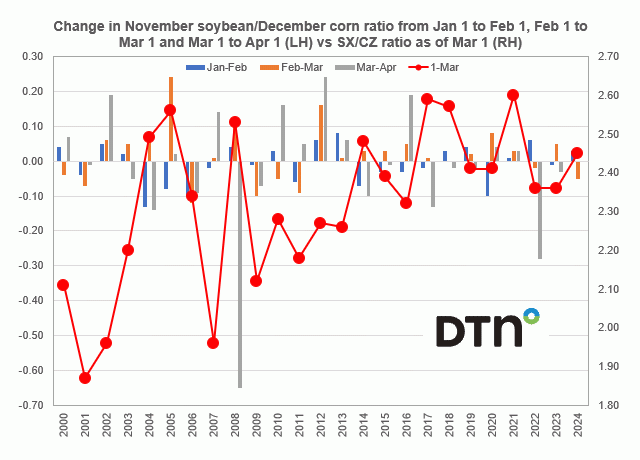
Change in November soybean/December corn ratio from April 1 to May 6 since 1996 vs. the change in U.S. corn and soybean planted area from the March 31 Prospective Plantings to the June 30 Acreage Report
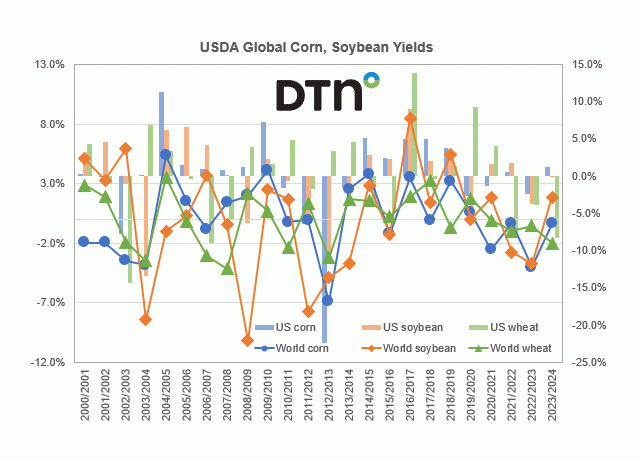
Percent deviation from the 2000-2023 trend for U.S. corn, soybean and wheat yields vs. world corn, soybeans and wheat percent deviations.
The results of annual tour of Kansas wheat fields could show weaker yield estimates due to ongoing drought.
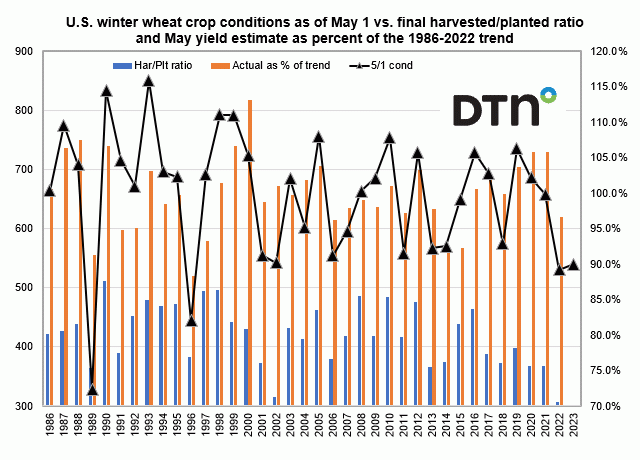
Conditions for the U.S. winter wheat crop right around May 1 vs. percent of the 1986-2022 trend of the USDA's May estimate of the U.S. winter wheat yield along with the final harvested to planted ratio
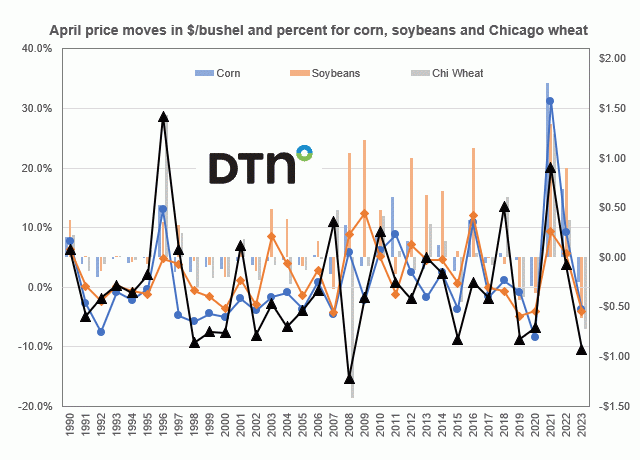
April net monthly price moves vs. percent change for nearby corn, soybeans and Chicago wheat.
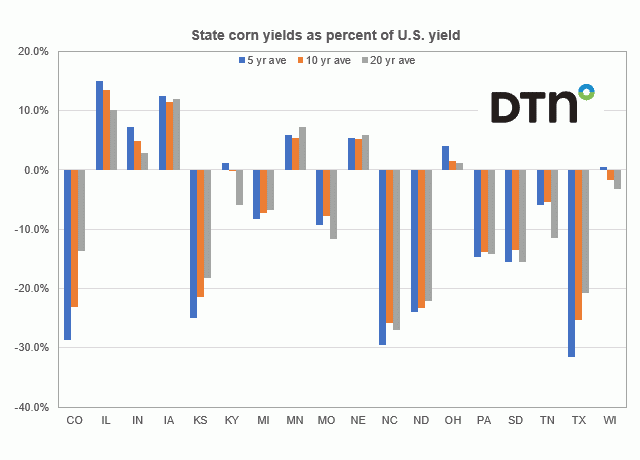
State yields of the top 18 corn producing states as a percent of the U.S. yield looking at the twenty, ten and five-year averages.
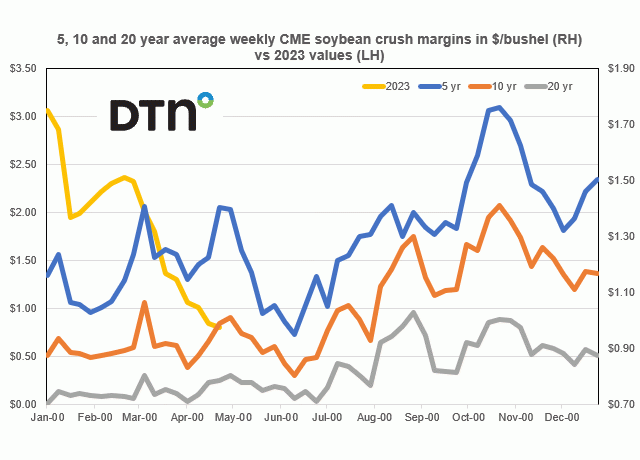
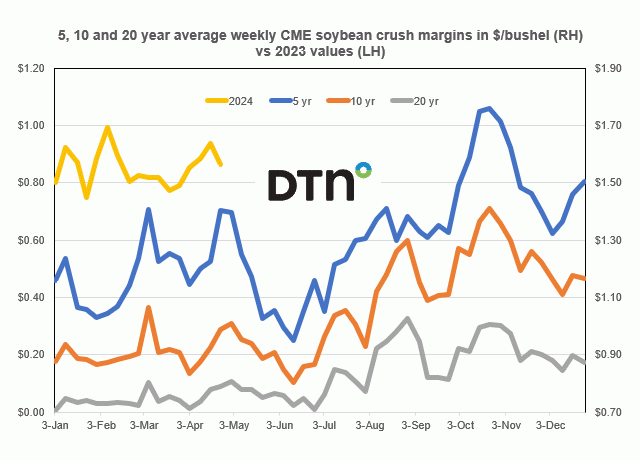
Five, ten and twenty-year average weekly CME soybean crush margins vs. the weekly 2023 values
U.S. soybean export sales and shipments as of the second week of April and as a percent of the April WASDE projection.
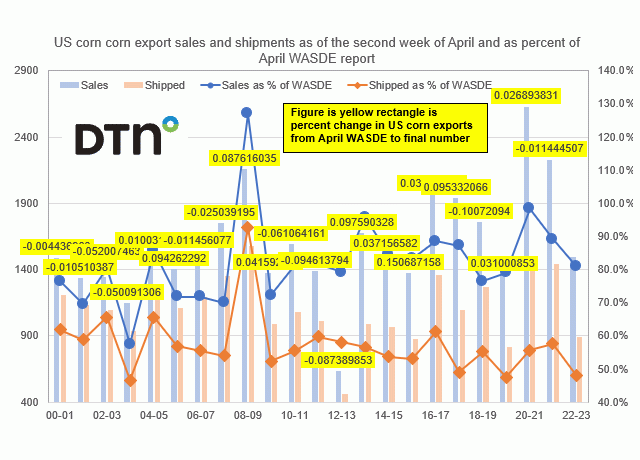
U.S. corn export sales and shipments as of the second week of April and as a percent of the April WASDE projection
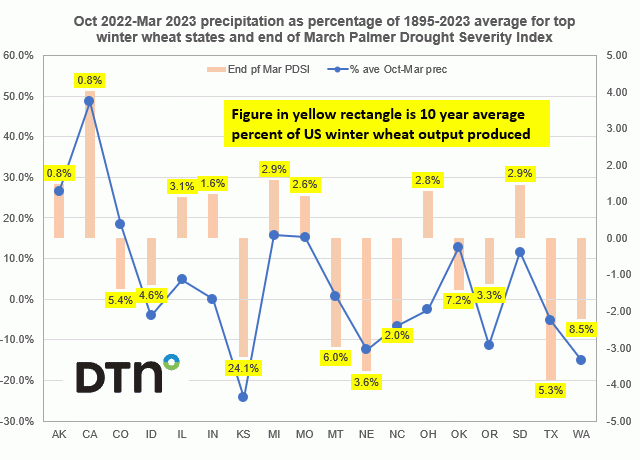
Oct 2022-Mar 2023 precipitation as percentage of 1895-2023 average for top winter wheat states and end of March Palmer Drought Severity Index
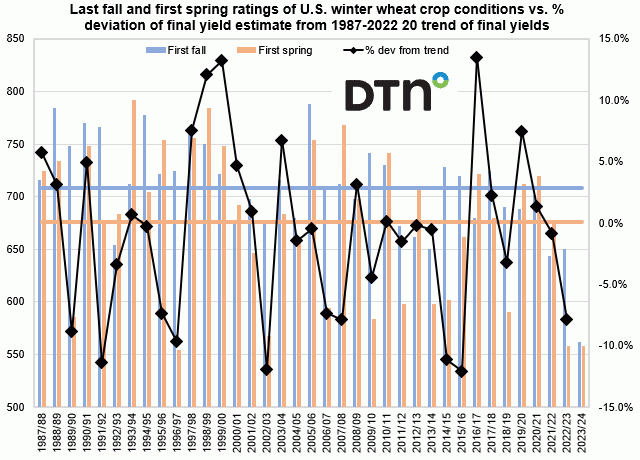
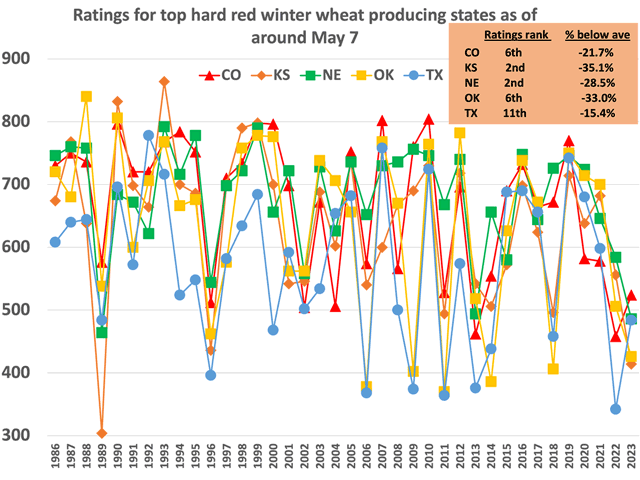
Last fall crop conditions for the U.S. winter wheat crop and the first spring ratings
10- and 20-year average percent changes in planted corn acreage for the top 18 producing states and the U.S. from the March intentions to the June acreage report vs June figures until final production report along with the total March to final planted acreage change
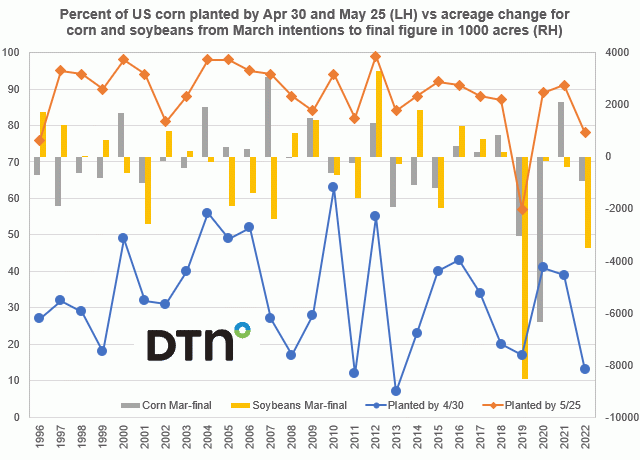
Percent of U.S. corn planted by April 30 and May 25 vs. acreage change for corn and soybeans from the March intentions to the final figure
Scatterplot showing the metric tons of corn per grain consuming animal unit vs. the average farm price expressed both in nominal terms or the actual figure the USDA posts and the real average farm price which is the nominal price adjusted for inflation
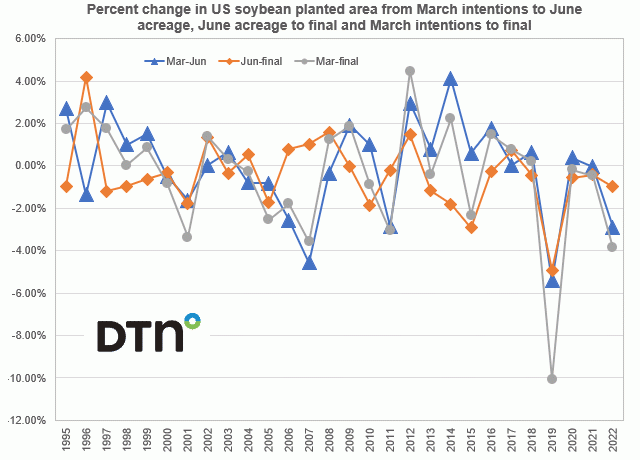
Percent change in U.S. soybean planted area from the March intentions to June acreage report, the June acreage to the final production figure and also the March intentions to the final number
Sunseed oil output out of Russia and Ukraine as a percent of world production vs. their exports as a percent of the global total while also reported is world sunflower seed oil production as a percent of the world vegoil total.
DIM[2x3] LBL[blogs-fundamentally-speaking-list] SEL[[data-native-ad-target=articleList]] IDX[2] TMPL[news] T[]
DIM[2x3] LBL[blogs-fundamentally-speaking-list-2] SEL[[data-native-ad-target=articleList]] IDX[5] TMPL[news] T[]