Fundamentally Speaking
Soybean Meal-Corn Ratio Nearing Highest Levels in Three Years
We have seen some divergent action in soybean meal and corn this past week.
The star of the show continues to be soybean meal which made new contract highs on heavy volume as the U.S. is exporting as large an amount of soybean meal as Argentina, the traditional number one exporter in the world out of supplies based on last year's horrific drought and currency considerations.
On the other hand, after popping to its highest levels since early August, December corn has slid back into the lower part of the longstanding range, nearing key support at $4.75 and after that the seasonal low at $4.67.
P[L1] D[0x0] M[300x250] OOP[F] ADUNIT[] T[]
Negative factors being focused on include recent talk of very good yields coming in on the latter planted fields that could prompt the USDA to lift its 2023 yield estimate and/or the likelihood of export sales falling short of current USDA projections.
As noted a number of times, traditional price vs stocks-to-use ratio scatter studies imply corn is very overvalued given a 2.1 billion bushel carryout and a 14.7% stocks-to-use ratio.
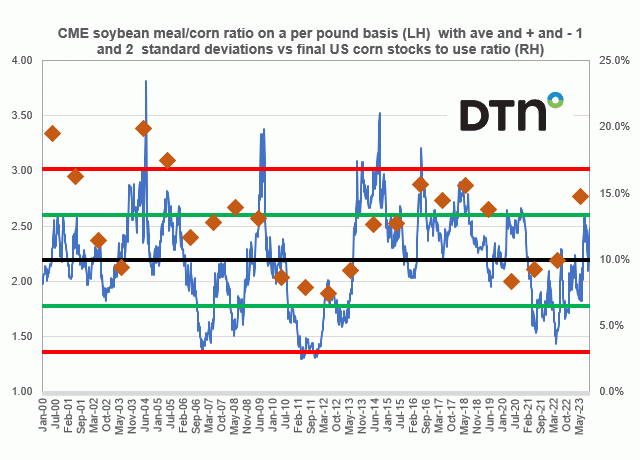
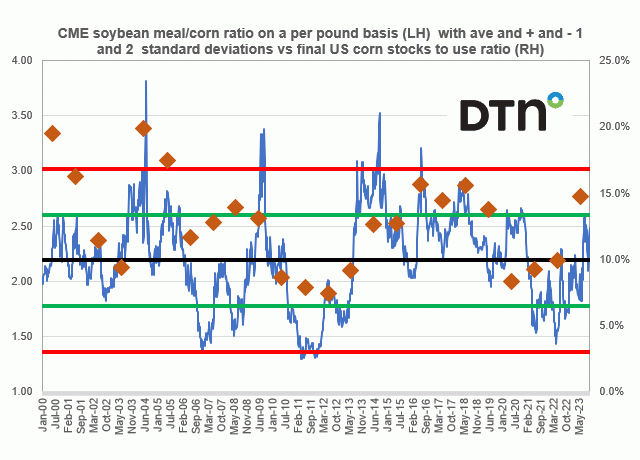
All of this made us curious to look at the CME soybean meal/corn ratio on a per pound basis which is what we do on this chart on the left-hand axis where the average, and plus and minus one and two standard deviation lines are also plotted.
We also report the final corn stocks-to-use ratio on the right-hand axis using data from 2000/01 to the current USDA 2023/24 projections.
Indeed, soymeal has gained on corn as the ratio has gone from 2.09 at the beginning of this month to 2.51 this week which, other than the 2.72 ratio in the middle of August, is about the highest ratio in the past three years.
That 2.72 ratio in August put values at the plus one standard deviation line meaning in the upper 16% of the trading range over the past 23 years at the highest SBM/corn ratio since mid-2018.
It appears the ratio often hits its peak in years when the U.S. corn stocks-to-use ratio is quite comfortable as this year's 14.7% ratio the highest in five years when as noted back in 2018 the SBM/corn ratio was also quite lofty, and also in 2004, 2009 and 2014, all years of hefty US stocks amid good production those seasons.
(c) Copyright 2023 DTN, LLC. All rights reserved.


Comments
To comment, please Log In or Join our Community .