Fundamentally Speaking
Argentina Corn, Soybean Trends
As noted in a prior piece, we will be looking at trends in global yields of key crops over time.
We started by looking at the world corn yields -- this year's past global yield in the 2022/23 season was 5.73 metric tons/hectare (mt/ha), the second largest negative deviation from the world corn trend yield in 20 seasons.
We also looked at this past year's soybean yield which at 2.71 mt/ha is the lowest since the 2016 season and also the second largest negative deviation from the world soybean trend yield in 20 seasons.
Given that Brazil had record crops of both crops and the last USDA yield estimates were just slightly below trend, we were curious if Argentine corn and bean yields were so bad that they single-handedly were responsible for such poor world yields relative to trend.
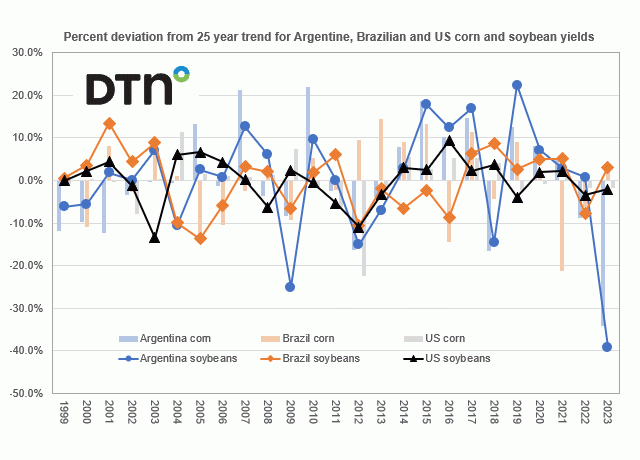
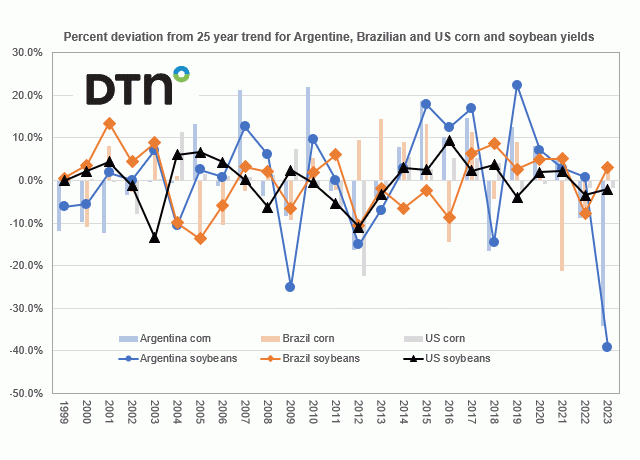
This chart calculates the percent deviation from the 25-year trend for Argentine, Brazilian and U.S. corn and soybean yields.
It is true that Argentina had a disastrous growing season as their 2022/23 corn yield at 5.08 mt/ha is easily the lowest since at least the 1999/2000 season and a whopping 34.1% below trend.
Their soybean crop was even worse as their yield this past season was a woeful 1.67 mt/ha, also the lowest of the past 25 years and a stunning 39.2% below the 25-year trend.
Consider that anything close to the USDA projection for Argentine corn yields to rebound by 52% and soybean yields by over 75% for the upcoming 2023/24 season could really result in a rather bearish global corn and soybean situation for next year if the ongoing expansion in Brazilian row crop output continues.
(c) Copyright 2023 DTN, LLC. All rights reserved.
P[L1] D[0x0] M[300x250] OOP[F] ADUNIT[] T[]


Comments
To comment, please Log In or Join our Community .