Fundamentally Speaking
Next USDA Crop Report Likely to Show Lighter Implied Soybean Pod Weights
As we noted in a piece last week, the USDA September crop production report has come and gone and the data was seen as somewhat negative given pre-report expectations.
The 2023 U.S. soybean yield came in at 50.1 bushels per acre (bpa) which was down from the 50.9 bpa given in August though right at the average trade guess and higher than last year's 49.5 bpa.
It is almost surprising that soybean yields have held up so well given crop ratings around Labor Day were the lowest since 2013.
The jury is still out however as USDA will release subsequent reports in October, in November, with the annual figures due out in January 2024.
There has been a lot of talk that the past month from mid-August to mid-September which has featured above normal temperatures and rather sparce rainfall over much of the Corn Belt has had an adverse impact on bean size that could result in lower than usual soybean pod weights.
P[L1] D[0x0] M[300x250] OOP[F] ADUNIT[] T[]
Note that the September report did include objective field surveys from USDA enumerators in addition to the results from the farmer-based surveys and data from remotely sensed satellites that formed the basis of the August numbers.
On the other hand, the October and November reports will also include lab analysis measuring pod weights that will give a more accurate assessment of both state and national soybean yields.
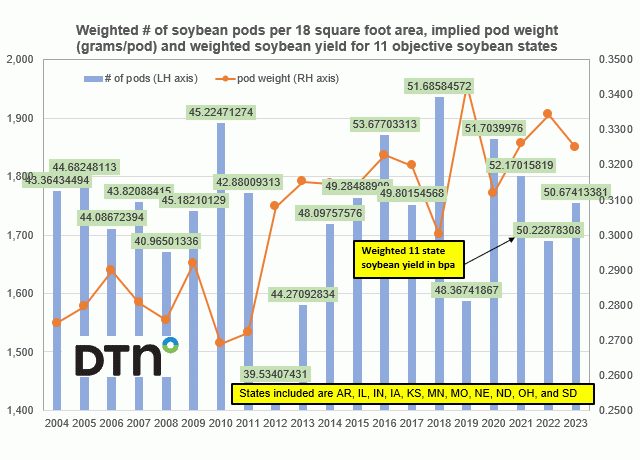
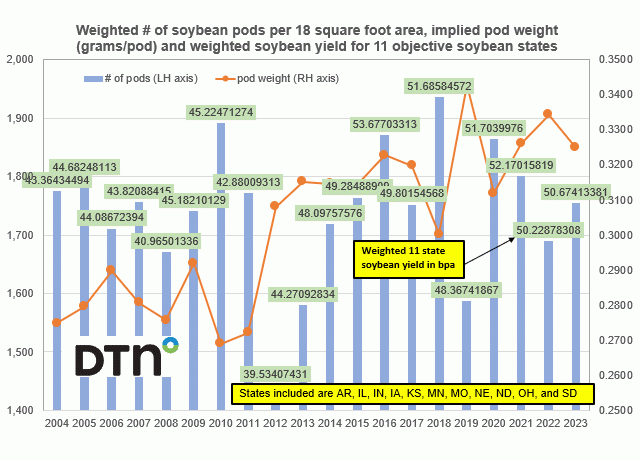
USDA-NASS did provide a slide in their crop production presentation showing the September 2023 Soybean Objective Yield measuring the number of soybean pods per 18 square foot area and yield for an 11-state region.
As we have done in the past, this graph shows the 11-state objective number of soybean pods per 18 square foot area on the left-hand axis vs. the implied soybean pod weight in lbs./pod on the right-hand axis.
The 11-state weighted yield is also reported in the green rectangles.
The eleven states are AR, IL, IN, IA, KS, MN, MO, NE, ND, OH, and SD.
The chart shows figures that match up very well with the USDA as their crop production report says the number of soybean pods per 18 square foot area in the 11-state region was 1755 which is what we have.
USDA also appears to have a weighted eleven state yield of just above 50.0 bpa while we have calculated that yield at 50.7 bpa.
History shows that often the USDA number of pods within an 18 square foot region will increase from September into the final report and that may be so.
Given the rapid dry down of this year's soybean crop however, it seems entirely reasonable to suspect that the implied soybean pod weight will also decline in subsequent reports, perhaps dramatically so as we have already heard about early harvested soybean fields having far lower soybean seed sizes than a year ago.
(c) Copyright 2023 DTN, LLC. All rights reserved.


Comments
To comment, please Log In or Join our Community .