Fundamentally Speaking
Stocks-to-Use Ratios of Corn and Beans
With the growing season coming to an end, row crop markets are making the transition from one driven by supply considerations to focus now more on demand factors and in that regard, the slow start to 2023/24 corn and soybean export sales are a negative influence.
Brazil continues to dominate the global soybean trade, scoring key sales to the world's largest customer China at a time when the U.S. usually has the upper hand.
Corn sales are also lagging when USDA is looking for a sizable 23% increase in exports vs. year ago levels.
P[L1] D[0x0] M[300x250] OOP[F] ADUNIT[] T[]
Part of the reason is expectations of a large build in corn and soybean stocks on a global basis which is dominated by the three large producers of Argentina, Brazil and the U.S.
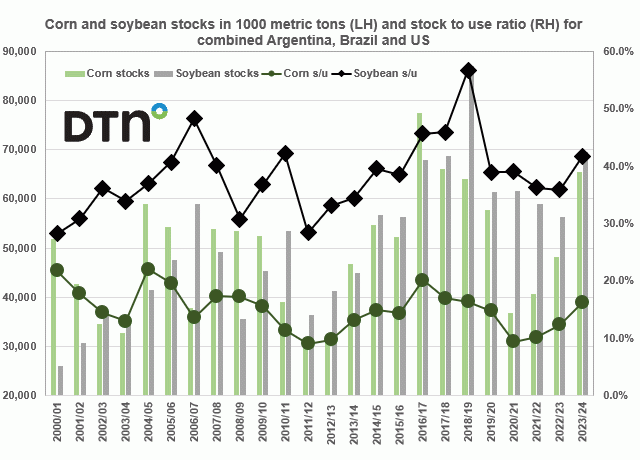
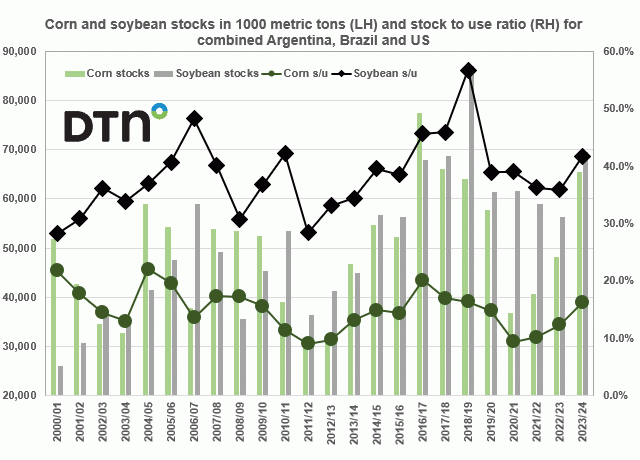
This graphic shows the corn and soybean stocks of those three combined in 1000 metric tons on the left-hand axis with the aggregate stocks-to-use ratio plotted on the right-hand axis.
The U.S. is in its early stages of harvesting its 2023/24 corn and soybean crops while Argentina and Brazil are just getting started planting theirs.
As we had noted in a prior blog piece, Argentina had a disastrous growing season as their 2022/23 corn yield at 5.08 metric tons/hectare (mt/ha) easily the lowest since at least the 1999/2000 season and a whopping 34.1% below trend.
Their soybean crop was even worse as their yield this past season was a woeful 1.67 mt/ha, also the lowest of the past 25 years and a stunning 39.2% below the 25-year trend.
Consider that anything close to the USDA projection for Argentine corn yields to rebound by 52% and soybean yields by over 75% for the upcoming 2023/24 season could really result in a rather bearish global corn and soybean situation for next year if the ongoing expansion in Brazilian row crop output continues.
The USDA in its September WASDE report indicated combined ending stocks for Argentina, Brazil and the U.S. at 65.4 million metric tons (mmt) which is the second largest total since 2017/18 and the 16.2% stocks-to-use ratio the highest in five seasons.
Soybean combined ending stocks pegged at 69.6 mmt are the second highest ever next to 2018/19 and the resultant 41.6% stocks-to-use ratio is also the highest since that season.
(c) Copyright 2023 DTN, LLC. All rights reserved.


Comments
To comment, please Log In or Join our Community .