Fundamentally Speaking
US Corn Export Shipment Pace
In last week's WASDE report, USDA kept U.S. 2022/23 corn exports unchanged at 1.925 billion bushels but with weekly export inspections as of the beginning of this week running more than 35% below year ago levels, it seems further overseas sales reductions are in the cards.
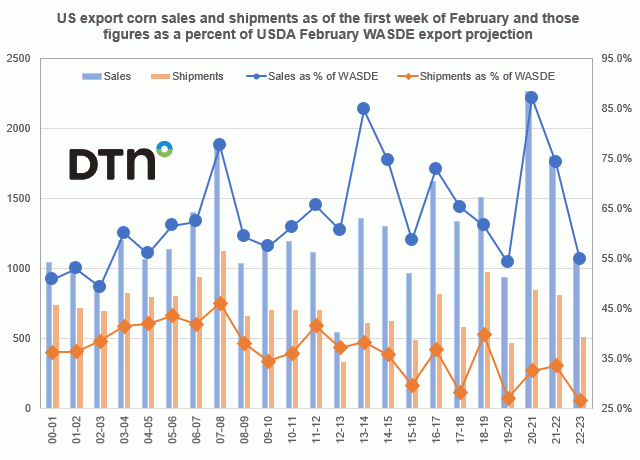
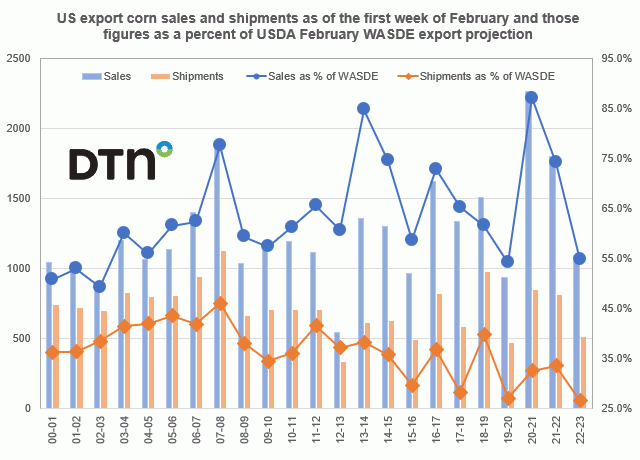
This graphic shows U.S. corn export sales and shipments in million bushels as of the first week of February on the left-hand axis and those figures as a percent of the February WASDE projection on the right-hand axis.
P[L1] D[0x0] M[300x250] OOP[F] ADUNIT[] T[]
Current sales at 1.055 billion bushels are the third lowest since the 2012/13 season and a mere 54.8% of the February WASDE projection which is about the lowest percent in over 20 years.
Shipments at 512 million bushels are also the third lowest since the 2012/13 marketing year and at 26.6% of the 1.925 billion export estimate is the lowest percent at least going back to the 1990/91 season, and possibly ever.
This is linked not only to the lagging sales pace but the low water levels on the Mississippi River, a main shipping channel for Midwestern grains to overseas markets that hampered timely corn shipments last fall.
Expectations that the current U.S. corn carryout could increase over the next few months from lower export projections is one of the main bearish factors for corn.
The other as we get closer to the start of the 2023 growing season are ideas that a sizable increase in U.S. corn planted area this spring, along with a return to a trend-type yield for this season estimated near 180 bushels per acre could push the 2023/24 U.S. corn ending stocks figure closer to 2.0 billion bushels.
(c) Copyright 2023 DTN, LLC. All rights reserved.


Comments
To comment, please Log In or Join our Community .