Fundamentally Speaking
Nov Bean/Dec Corn Ratio 2nd Lowest in 10 Years
The average settlement for Chicago Board of Trade December corn and November soybean futures during the month of February, which are used by the USDA to set their crop insurance policy guaranteed prices for the 2023 growing season, are set at $5.91 per bushel for corn and $13.76 for soybeans.
This price is the highest since the $6.01 in 2011 for corn and up a penny from $5.90 in 2022 and the second highest for soybeans after last year's record high of $14.33.
This news comes after the initial planting projections were released by the USDA at their annual Ag Outlook Forum last week of 91 million acres for corn in 2023, up from 88.6 million acres the previous year, and 87.5 million acres of soybeans, steady with 2022.
Studies suggest that given these guaranteed prices, plantings of both corn and soybeans will be profitable this year though question is which one will have higher per acre returns.
P[L1] D[0x0] M[300x250] OOP[F] ADUNIT[] T[]
Note that using the average guaranteed prices, the November soybean/December corn ratio comes in at 2.33 which is about the average seen in recent years.
It is thought a ratio in excess of 2.33 would favor increased soybean seedings vis-à-vis corn and vice-versa though this ratio can change over time and has.
Case in point, just a year ago when the SX2022/CZ2022 ratio fell from 2.45 on February 17 to as low as 2.00 by May 11 as markets tried to entice farmers to stick with their intended corn seedings even as a wet spring delaying plantings.
Still final 2022 corn planted area at 88.6 million were well below USDA Ag Outlook projection of 92.0 million while soybean acreage basically was unchanged from Feb Ag Outlook projection to final figure.
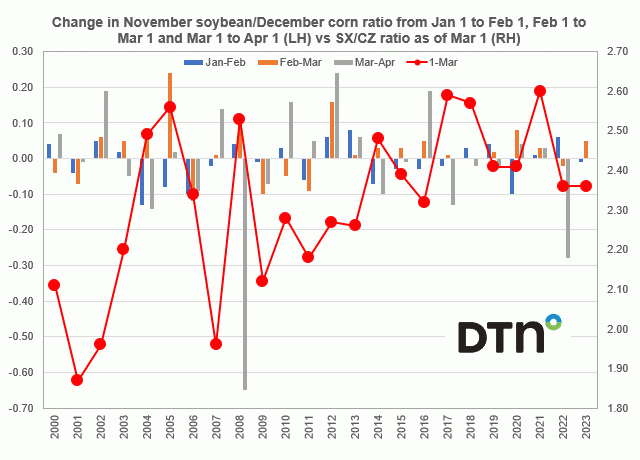
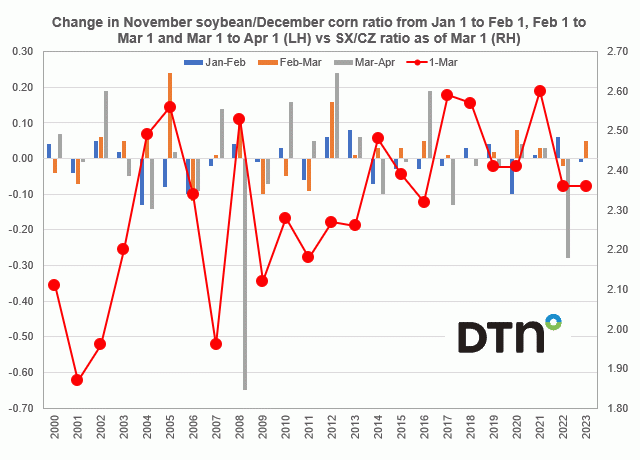
This chart shows the change in the November soybean/December corn ratio from Jan 1 to Feb 1, Feb 1 to Mar 1 and Mar 1 to Apr 1 on the lefthand axis vs the SX/CZ ratio as of Mar 1 on the right-hand axis.
Seeing that the year ago Mar 1 to Apr 1 0.28 decline in the ratio the second largest during March other than the -0.65 drop in 2008 as December corn rallied over $1.25 per bushel while soybeans traded essentially sideways.
This year's March 1 ratio at 2.36 equal to a year ago and the second lowest in ten years.
There has been talk that in light of last week's Ag Outlook acreage figures, beans may have to rally vs. corn to buy back some acreage and that process appears to have started as current ratio of 2.40 highest for SX2023/CZ2023 since late October 2021.
(c) Copyright 2023 DTN, LLC. All rights reserved.


Comments
To comment, please Log In or Join our Community .