by
Joel Karlin
,
DTN Contributing Analyst
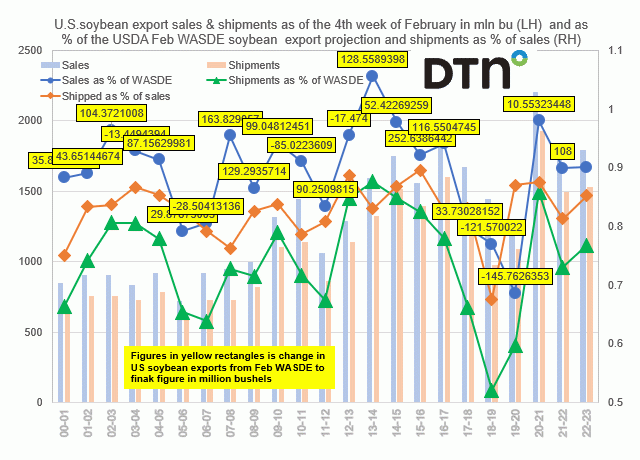
U.S. soybean export sales & shipments as of the fourth week of February in million bushels vs. these sales and shipment figures as a percent of the USDA's February WASDE export projection.