Fundamentally Speaking
US Corn & Soybean Stocks/Use Ratios
Not too many fireworks in last week's WASDE figures but there will be a slew of reports out January 12th including the quarterly grain on and off farm stocks as of December 1 and the final 2022 crop production of the year.
In the January WASDE report based on the 12/1 stocks and final crop report, USDA will be better able to determine what usage was in Sep-Nov period.
P[L1] D[0x0] M[300x250] OOP[F] ADUNIT[] T[]
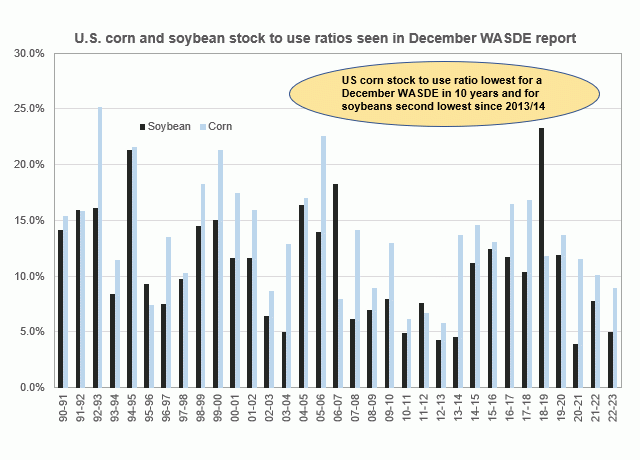
Seeing some talk that final 2022 corn and bean yields could be above the 172.4 bushels per acre (bpa) corn and 50.2 bpa soybean estimates given in the November crop production report, though the fact is the USDA current corn stocks-to-use ratio is the lowest for the December WASDE report in ten seasons while the current 2022/23 soybean stocks-to-use ratio is the second lowest for this month since the 2013/14 season.
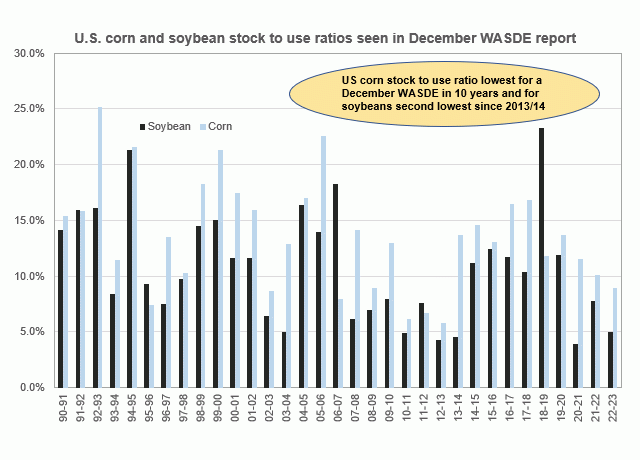
This graphic shows the U.S. corn and soybean stocks-to-use ratios seen in the December WASDE report from the 1990-91 season to the figures furnished last week.
The current soybean stocks-to-use ratio at 5.0% is the fourth lowest since 1990 and less than half the 30-year average of 10.8%.
As for corn, the current stocks-to-use ratio at 8.9% is below the 30-year average of 13.6% and the lowest for December since December 2012 at 5.8% which is the tightest ever and the fourth consecutive year of falling stocks-to-use ratios.
Interesting to note that new crop December 2023 corn is trading today at $5.95 vs $5.46 a year ago when the stocks-to-use ratio was 10.1%, while November 2023 soybeans trading are at $13.93 today vs. a year ago when the November 2022 contract was trading at $12.43 with a stocks-to-use ratio of 7.8%.
(c) Copyright 2022 DTN, LLC. All rights reserved.


Comments
To comment, please Log In or Join our Community .