Fundamentally Speaking
Corn Stock-to-Use Ratios in May WASDE
We are getting our first weather scare of the year as December corn has bounced close to 60 cents from the lows made on May 18.
Still, that was after a long descent really starting the first of the year where new crop corn had fallen over $1.20 per bushel based on some macro market factors such as higher interest rates, fears of a global recession crimping demand and the makings of a record corn crop in Brazil.
Here in the U.S. additional price pressure has come from the March corn planting intentions figure of 92.0 million, higher than what the trade had expected and the USDA's 2023 yield forecast of 181.5 bushels per acre (bpa), a very aggressive figure and well above the prior high.
As a consequence, USDA in the May WASE report pegged the 2023 corn crop at a record 15.3 billion bushels (bb) and this combined with total corn usage up just 5% from a year ago had the USDA in its first forecast for the 2023/24 ending stocks come in at 2.222 bb.
P[L1] D[0x0] M[300x250] OOP[F] ADUNIT[] T[]
This figure is up 805 million bushels (mb) from last year and if realized would be the highest in absolute terms since 2016/17 as these stocks would represent 15.3 percent of use, the highest since 2018/19.
What will be the situation be in a few months, let's say when the USDA releases its November 2023 WASDE, six months down the road?
By that point we will have a better idea of how demand for the rest of this marketing year held up in the face of what are still historically high values.
By then the trade also will have a pretty good fix in the size of this year's crop as that will have a huge bearing on total supplies, forecasted consumption and of course price direction.
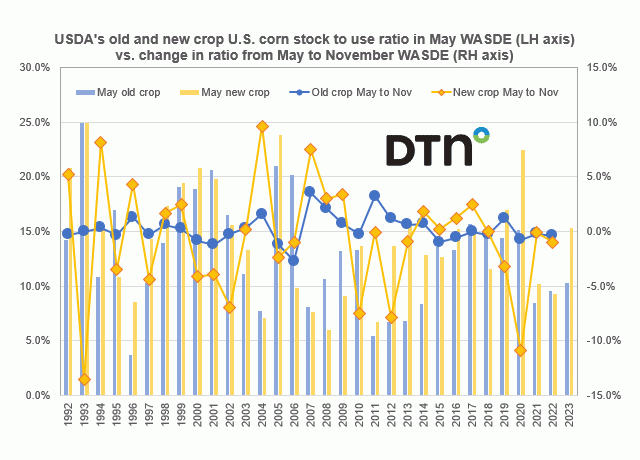
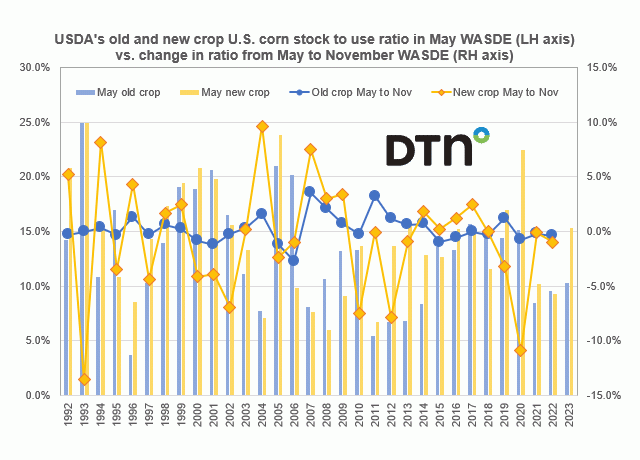
This graphic shows the USDA's old and new crop U.S. corn stocks-to-use ratios in the May WASDE report on the left-hand axis vs. the change in both the old and new crop U.S. corn stocks-to-use ratios from the May to November WASDE reports on the right-hand axis.
For old crop, there is not usually much of change in the stocks-to-use ratio for the May to November reports as demand at that point has been locked in for 8 of the 12 months of the marketing year.
We surmise that the makings of a good crop probably result in the lowering of the old crop stocks-to-use ratio from May to November as that is usually a price negative factor that would encourage perhaps a slight increase in old crop demand, while conversely, if the new crop outlook is poor that usually results in higher prices suppressing demand that would result in a higher stocks-to-use ratio in November than in May.
The change in the new crop stocks-to-use ratio from May to November hinges even more on the new crop outlook.
(c) Copyright 2023 DTN, LLC. All rights reserved.


Comments
To comment, please Log In or Join our Community .