Fundamentally Speaking
2023 Bean Acreage May Rise Above 3/31 Intentions Figure
Both corn and soybean plantings are running ahead of schedule and that would seem to augur perhaps for at least modest increases in acreage for both above the prospective planting figures.
Early season challenges however, including widespread drought in the Southern and central Plains where corn and soybean acreage has really expanded over the past 20 years, along with extreme wetness in much of North Dakota that has limited seeding and germination could mitigate any substantial rise in seeded area.
Nonetheless this is a positive development after three of the past four seasons saw a late start to both corn and soybean plantings resulting in final acreage falling well short of the March intentions.
P[L1] D[0x0] M[300x250] OOP[F] ADUNIT[] T[]
In particular, there is now hope that the 2023 U.S. soybean planted area can expand above the surprisingly low 3/31 intentions figure of 87.5 million acres.
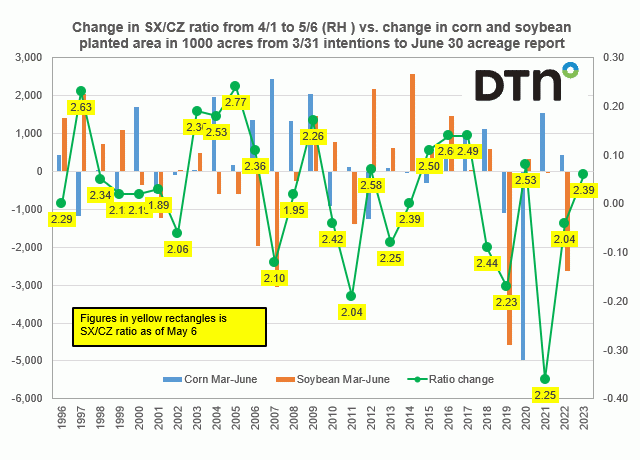
This graphic shows the change in the November soybean/December corn ratio from April 1 to May 6 since 1996 on the right-hand axis while on the left-hand axis is the change in U.S. corn and soybean planted area in 1000 acres from the March 31 Prospective Plantings to the June 30 Acreage Report.
The figures in the yellow rectangles are the SX/CZ ratios as of May 6th.
A look back at SX/CZ ratio action for this time period over the past 27 years shows that the largest ratio decline of -0.36 was two years ago resulting in corn area rising by 1.548 million acres, the largest increase between the 3/31 and 6/30 reports since 2009.
This year the ratio actually increased between April 1 and May 6 by 0.06 to finish at 2.39, which is slightly above the long considered break-even point of 2.35 as soybeans tried to buy back some acreage from corn after this year's March intentions report where the 92 million corn figure was above trade expectations while the 87.5 million bean figure is well below what has been anticipated.
The largest increase in the ratio was seen in 2005 at 0.24 which resulted in very little acreage change, and in 1997 at 0.23 which did result in a substantial fall in corn area and a sizable increase in soybean acreage.
Those years also saw very high SX/CZ ratios as of May 6 at 2.63 in 1997 and 2.77 which is the highest ratio as of May 6, at least going back to 1996.
(c) Copyright 2023 DTN, LLC. All rights reserved.


Comments
To comment, please Log In or Join our Community .