Technically Speaking
US Dollar Index Encounters First Bearish Hit
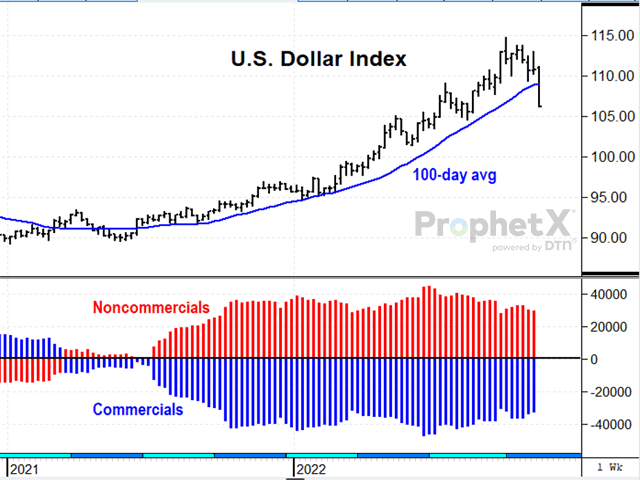
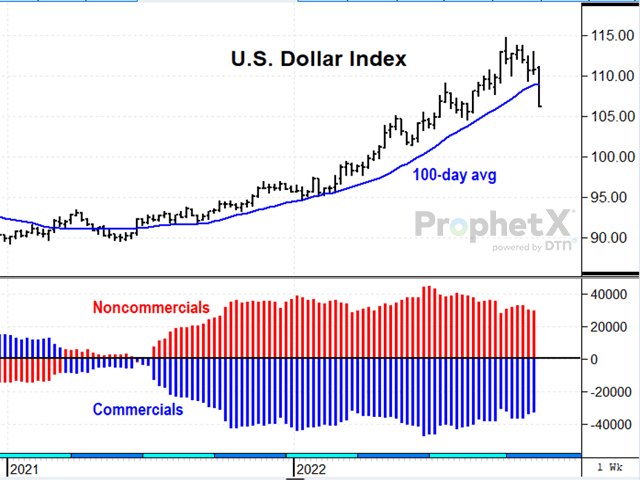
The U.S. Dollar Index fell 4.13 points last week, ending Friday, Nov. 11 at 106.42, the lowest close in nearly three months and the first weekly close below the 100-day average since June 2021. The spark that triggered last week's selling was the smaller-than-expected 0.4% gain in October consumer prices the Labor Department reported Thursday. Inflation is still running well above the Fed's 2% annual target and odds are high The Fed will still increase the federal funds rate again when it meets on Dec. 13, but this was the first time bullish assumptions for the U.S. were challenged in over a year and specs likely responded by jumping out of their positions. Fundamentally, it is difficult to see much bearish potential after last week's bearish response. Technically speaking, the momentum of the 16-month uptrend has been broken and the August low of 104.64 is a good candidate for near-term support.
S&P 500 INDEX:The S&P 500 Index closed up 222.38 points (6%) last week, ending Friday at 3,992.93, the highest close in nearly two months and back above its 100-day average, encouraged by the same consumer price index report mentioned above. The index has been in a choppy downtrend all year, pressured by the anticipation of rising interest rates and by a fear of recession. The falling stock market has also been a bearish source of influence for crop prices since summer as fears of recession led to noncommercial selling in several commodity markets. Technically, it is interesting that the Oct. 13 low of 3,491.58 marked a 50% retracement of the move from the low in March 2020 to this year's January high, a possible source of support. Last week's rally enhances a previous bullish turn in the weekly stochastic and suggests prices may have farther to go.
P[L1] D[0x0] M[300x250] OOP[F] ADUNIT[] T[]
The Shanghai Composite Index closed up 102.65 points (3%) last week, ending at 3,099.65 Friday, the highest close in over a month, but below the 100-day average. Similar to the U.S. stock market, China's index has had its ups and downs in 2022 but has traded mostly lower. China does not have an inflation problem, but the economy has performed slower in 2022, hampered by its strict zero-policy response to COVID infections that keep popping up like a whack-a-mole game. For soybean traders, worries about China's economy have often translated to caution in the soybean market, but there has not been any sign of slower soybean demand from China yet. Technically speaking, the Shanghai Composite Index posted a bullish turn in the weekly stochastic last week, leaving behind a possible double-bottom formation. The bullish potential in this index coincides with a report from the Wall Street Journal Friday that China's government is starting to ease COVID restrictions in an effort to help the economy.
**
Comments above are for educational purposes and are not meant to be specific trade recommendations. The buying and selling of grain and soybean futures involve substantial risk and are not suitable for everyone.
Todd Hultman can be reached at Todd.Hultman@dtn.com
(c) Copyright 2022 DTN, LLC. All rights reserved.


Comments
To comment, please Log In or Join our Community .