

Canada Markets
A Look at Canola's Forward Curve

The canola market signaled a drastic change in sentiment on Oct. 18 which bears watching. Canola closed lower along with soybean oil, European rapeseed and Malaysian crude palm oil. Daily charts for the four most active contracts -- January canola, December soybean oil, January palm oil and February rapeseed -- show canola the first to reach a fresh low for the month of October, with January canola dipping to a low of $704/metric ton (mt).
Prior to today, psychological support at $700/mt was viewed as support on the November chart, now it will be counted on to support the January contract.
It may take time to see just what canola traders are reacting to. Today's International Grains Council Grain Market Report for October included bearish revisions, with 1 million metric tons (mmt) of production added, including 600,000 mt for Europe and 400,000 mt for Russia, while supplies for 2023-24 were increased by 1.4 mmt, which must include an increase in 2022-23 ending stocks.
P[L1] D[0x0] M[300x250] OOP[F] ADUNIT[] T[]
The IGC's global carryout forecast was increased from 5.3 mmt to 6.2 mmt this month, which places them close to the current USDA estimate. Today's data signals a 7.2% stocks/use ratio for 2023-24, down from 9% in the previous crop year. It is interesting to note that the IGC continues to show a 16.5 mmt production estimate for Canada, lower than Canada's official estimate. An IGC chart also points to 2023-24 stocks of major exporters falling to a level that may be the lowest level in 10 years.
Despite the bearish close today, the track Vancouver basis was reported to roll from $40/mt over the November to $36/mt over the January contract, while this signals a $9/mt increase in the track cash trade due to today's $13/mt Nov/Jan futures spread.
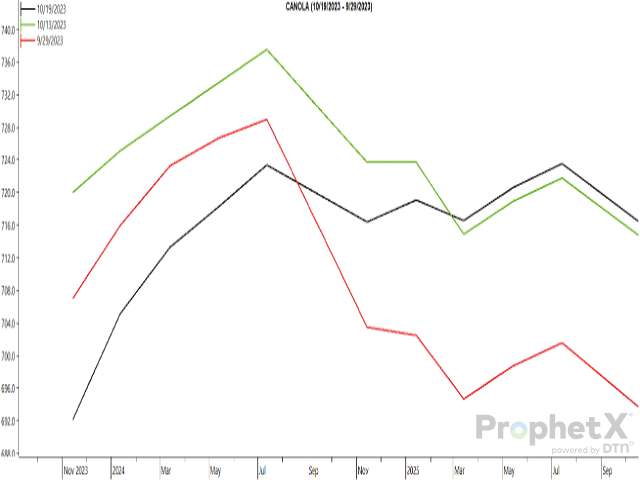
The attached chart signals the progression in the forward curve for canola over recent weeks. The red line shows this curve for Sept. 29, the green line as of the end of last week or Oct. 13 while the black line represents the curve following the bearish close of Oct. 19.
The steepening curve from today's close signals an increasingly bearish view of fundamentals. If we consider the Nov/July spread, this has changed from minus $22/mt on Sept. 29, to minus $17.50/mt on Oct. 13 to a bearish close of minus $31.20/mt on Oct 19. The five-year average for this spread on this date is plus $1.24/mt (November over the July), largely due to the $75.80/mt inverse reported on this date in 2021-22.
The supportive data needed for this market may be seen in the Canadian Grain Commission's week 11 Grain Statistics Weekly, covering activity for the week ending Oct. 15, with exports of 214,500 mt reported. This is the largest weekly exports seen this crop year, and the largest seen in 29 weeks. Despite the smaller crop, cumulative exports are just 4.4% below the same period last crop year.
The CGC's data also shows massive domestic disappearance of 321,800 mt for the week, with cumulative disappearance reported up 14.1% from last year. Historically high crush margins continue to signal an incentive to crush.
Cliff Jamieson can be reached at cliff.jamieson@dtn.com
Follow him on X, formerly known as Twitter, Cliff Jamieson
(c) Copyright 2023 DTN, LLC. All rights reserved.
Comments
To comment, please Log In or Join our Community .