Canada Markets
European Wheat Technical Signals to Watch
One positive feature in Oct. 18 markets was favorable economic data from China, with RTTNews.com reporting on ProphetX that China's Gross Domestic Product for the recent quarter, along with retail sales and industrial output data, all exceeded expectations. While GDP was reported at 4.9% for the third quarter, below the 6.3% reported for the previous quarter, it remained above the 4.4% level that was expected.
This comes at a time when China's year-to-date wheat imports for the January-through-September period are reported to be 66% higher than the same period last crop year.
While huge Russian supplies have largely dominated global markets, some cracks are appearing that can't be ignored. As indicated by Black Sea analyst Andrey Sizov, Russia's open wheat sales total 2 million metric tons (mmt), "which is OK number if you have 20-30 mmt to ship in the current season, and that's a disaster if you want to ship 50 mmt in 23-24, as the USDA suggests."
P[L1] D[0x0] M[300x250] OOP[F] ADUNIT[] T[]
While the December Chicago soft red winter wheat contract is seen holding above support of the contract's 20-day moving average, both hard red winter and hard red spring are holding below their respective 20-day moving average. December HRS has failed to hold gains above its 20-day in each of the past two sessions.
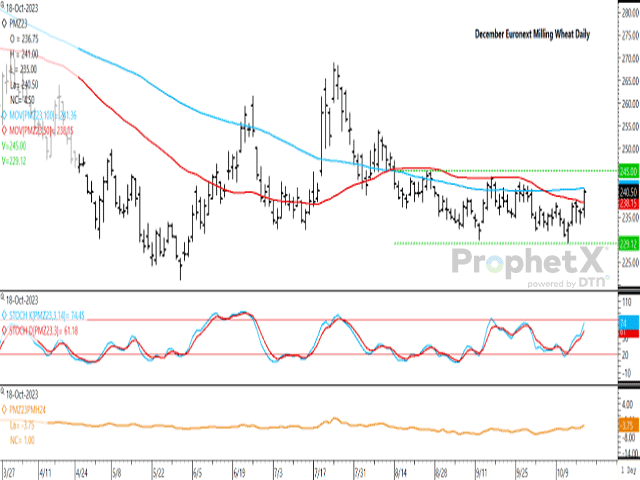
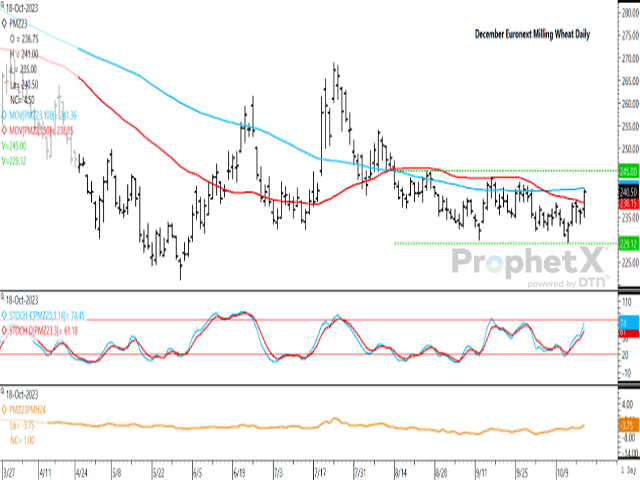
Compare this to the December European milling wheat contract, as seen on the attached chart. The Oct. 18 gain of EUR 4.50/metric ton (13 cents/bushel USD) is the largest one-day move in 17 sessions. Today's close was the first close above the contract's 50-day moving average (red line) since Aug. 11 or more than two months, while today's high fell just short of testing the contract's 100-day moving average (blue line).
For more than two months, trade has held within a range of EUR 15.75/mt, as seen by the green horizontal dotted lines, while today's close is clearly in the upper one-half of the two-month range. A move equivalent to today's move would see the upper boundary of this range tested. A breach of this resistance at EUR 245 would signal the potential for an upward target of EUR 260.75/mt. Such a move would represent a price above the 68.2% retracement of the move from the contract's July high to October low, which could lead to increased buying activity as various retracement levels are breached.
The first study shows the stochastic momentum indicators trending higher on the daily chart, while still in neutral territory, signaling that a further upward move may be possible.
The lower study shows the Dec/March contract spread, which narrowed to minus EUR 3.75/mt, the narrowest close since Aug. 10.
Cliff Jamieson can be reached at cliff.jamieson@dtn.com
Follow him on X, formerly known as Twitter, Cliff Jamieson
(c) Copyright 2023 DTN, LLC. All rights reserved.


Comments
To comment, please Log In or Join our Community .