Canada Markets
A Look at 2021 Price Changes for Select Commodities
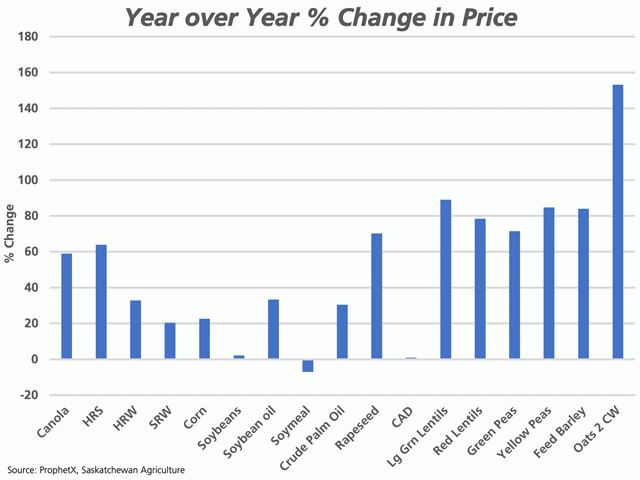
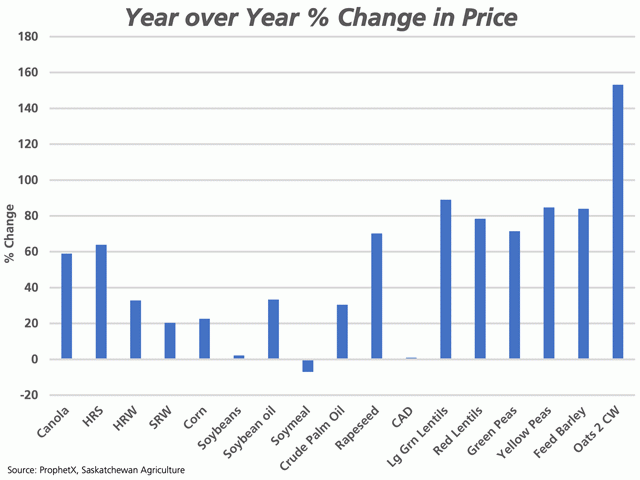
The attached chart shows the percent change in both futures and select cash prices from Dec. 31, 2020, to Dec. 31, 2021. The continuous active future was used for this calculation, along with the spot Canadian dollar and cash data reported by Saskatchewan Agriculture, based on product delivered to Saskatchewan plants.
Of the markets shown, soymeal was the only market to show a loss over the year, falling by 7.1%. Across the rest of the markets showing gains, the spot Canadian dollar and the continuous active soybean contract ended the year close to where it began, gaining 1% and 2.2%, respectively.
P[L1] D[0x0] M[300x250] OOP[F] ADUNIT[] T[]
By far, the largest gain shown is the 153% gain reported in Saskatchewan government's cash data for oats. At the same time, the most recent report shows trade at $536.54/mt or $8.27/bushel (bu), which may be viewed as below the market, especially if one is inclined to store grain for delivery in forward positions.
Higher prices will be viewed differently depending on circumstance. For those negotiating the buy-out of contracts due to shortfalls or for prairie feed users, higher prices are problematic. They are also contributing to higher input costs and may have an effect on land prices and rental costs.
At the same time, the tight stocks forecast for many crops at the end of 2021-22 will lead to price volatility and will continue to support prices, leading to significant opportunity for growers in the year ahead.
Happy New Year and best wishes for 2022!
Cliff Jamieson can be reached at cliff.jamieson@dtn.com
Follow him on Twitter @Cliff Jamieson
(c) Copyright 2021 DTN, LLC. All rights reserved.


Comments
To comment, please Log In or Join our Community .