Canada Markets
Projected 2022 Yields Based on the 2001-2020 Trend
The January release of the Canada: Outlook for Principal Field Crops will include a first look at the 2022-23 supply and demand estimates. The government will use a cautious approach to their production estimates given the continued dry conditions faced on the Prairies.
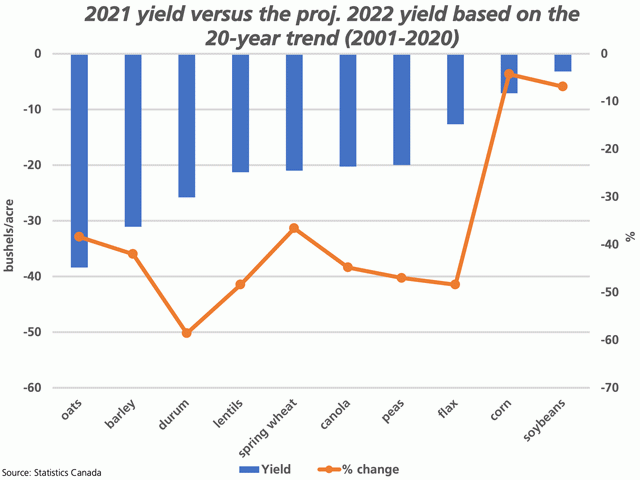
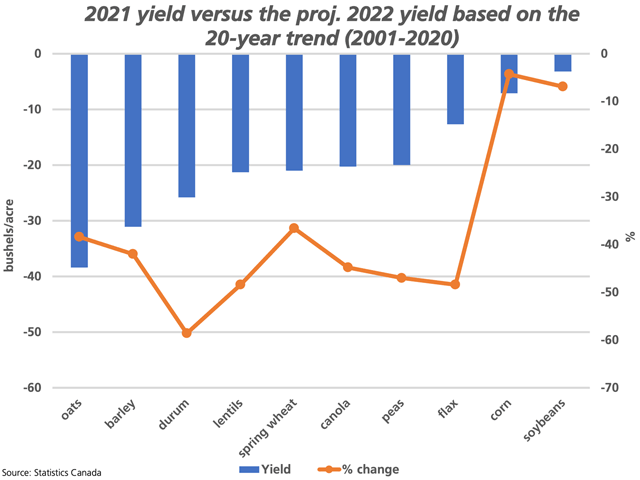
The attached chart shows the difference between average yields for 2021, as reported by Statistics Canada, and the 20-year trend (2001-2020) projected forward to 2022. The blue bars represent the yield differential, plotted against the primary vertical axis. This data is shown from the largest differential, or 38.4 bushels per acre (bpa) for oats, to the smallest differential, which is 3.2 bpa for soybeans.
P[L1] D[0x0] M[300x250] OOP[F] ADUNIT[] T[]
The brown line with markers represents the percent change in this data, calculated against the secondary vertical axis. The largest percentage difference is calculated for durum, with the 2021 average yield down 56.6% from the 2001-2020 trend projected forward to 2022.
This chart also highlights the varying conditions for Prairie crops as compared to the better conditions faced in the east. This month's Seasonal Summaries for Ontario corn and soybeans showed average yields for 2021 forecast at 175 bpa and 51.6 bpa, respectively, while in agreement with previously released Statistics Canada estimates. The 2021 national average yield was 7.1 bpa below the projected 2022 yield for corn and 3.2 bpa below for soybeans.
Cliff Jamieson can be reached at cliff.jamieson@dtn.com
Follow Cliff Jamieson on Twitter @Cliff Jamieson
(c) Copyright 2021 DTN, LLC. All rights reserved.


Comments
To comment, please Log In or Join our Community .