

Technically Speaking
Can Wheat Really Be Bullish?

A few days ago I received an email asking my opinion about the December Kansas City wheat chart. At first glance it is showing some interesting patterns, though I didn't want to do anything until after the hubbub of USDA's August Supply and Demand reports had died down.
Yes, I know, that's bad of me as a technical analyst. If markets do indeed follow chart patterns it shouldn't matter what government numbers have to say. After all, chart patterns discount fundamentals, meaning the information is already factored into trend. As I said, yes, I know all that. But there was no reason to jump in front of a train if I didn't have to.
P[L1] D[0x0] M[300x250] OOP[F] ADUNIT[] T[]
Anyway, now that USDA's hullabaloo has come and gone the December Kansas City wheat contract once again showed that technical signals can withstand a fundamental onslaught. The question is, what technical signals is the contract actually showing us?
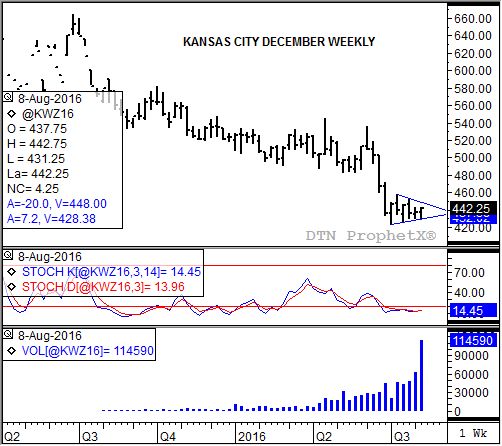
Take a look at its weekly chart. I've drawn in trendlines indicating the Dec KC's consolidation pattern over the last 6 weeks. The descending highs and ascending lows are usually seen in a pennant, a continuation pattern that tends to occur at the midpoint of a trend. However, this looks to be building at the bottom of a secondary downtrend, meaning Dec KC wheat is attempting to turn up.
Note weekly stochastics (middle study) posted a bullish crossover below the oversold level of 20% at Friday's close. The faster moving blue line (14.45%) crossed above the slower moving red line (13.96%), with both below 20%. This alone doesn't create an uptrend, but it is a reliable harbinger that a bullish change in trend is coming.
Now take a look at weekly trade volume (bottom study). Normally in a pennant pattern volume tends to decrease as the pattern develops. Not so here, with volume increasing until bursting this past week.
Ideally both the bullish crossover by weekly stochastics and a spike in volume would have occurred with some sort of bullish reversal signal by the futures contract itself. Dec KC didn't do that, coming up just short of last week's high of $4.43 1/2 (this past week's high of $4.42 3/4). However, a bullish reversal was posted by the Chicago December contract (traded outside of the previous week's range before closing higher for the week). And if Chicago December turns bullish, surely Kansas City is bound to follow.
To track my thoughts on the markets throughout the day, follow me on Twitter: www.twitter.com\DarinNewsom
Comments
To comment, please Log In or Join our Community .