

Technically Speaking
Soybeans Mix of Trends
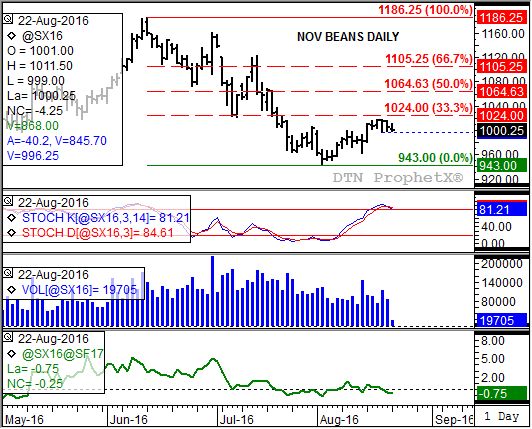
Last week saw November soybeans post a series of highs at $10.17 1/4 (Wednesday), $10.17 1/2 (Thursday), and $10.17 Friday; not quite able to break through to a solid test resistance at $10.24. The latter price marks the 33% retracement level of the previous downtrend from $11.86 1/4 (June 13) through the low of $9.43 (August 2).
As Monday gets under way the pullback from last week's highs has the contract in position to test support at last week's low of $9.96 1/4. Meanwhile, daily stochastics (short-term momentum indicator, second study) are nearing a bearish crossover above the overbought 80% level. A bearish crossover occurs when the faster moving blue line crosses below the slower moving red line, with both above the 80% mark. This usually indicates the momentum is turning bearish and trend turning down. These signals are best evaluated at the close.
Given these two possible signals, it appears the November soybean contract is in position to end the market's seasonal uptrend a week early. Both the 5-year and 10-year seasonal studies show Nov beans tend to rally through the end of August before turning down through the first week of October.
Interestingly enough, November beans' weekly chart continues to show an unfinished secondary (intermediate-term) downtrend. Initial support is at $9.62, a price that marks the 67% retracement level of the previous secondary uptrend from $8.50 through the $11.68 1/4 high. However, the week of August 1 saw Nov beans post that spike low of $9.43 mentioned above. Therefore the door is open to a possible test of the 76.4% retracement level near $9.29 1/4.
One last thing: As mentioned in the monthly analysis from August 1, the market's major (long-term) trend remains up. The monthly chart has that same support in the $9.29 to $9.30 area.
To track my thoughts on the markets throughout the day, follow me on Twitter: www.twitter.com\DarinNewsom
P[L1] D[0x0] M[300x250] OOP[F] ADUNIT[] T[]

Comments
To comment, please Log In or Join our Community .