

Technically Speaking
Monthly Analysis: Grain Markets
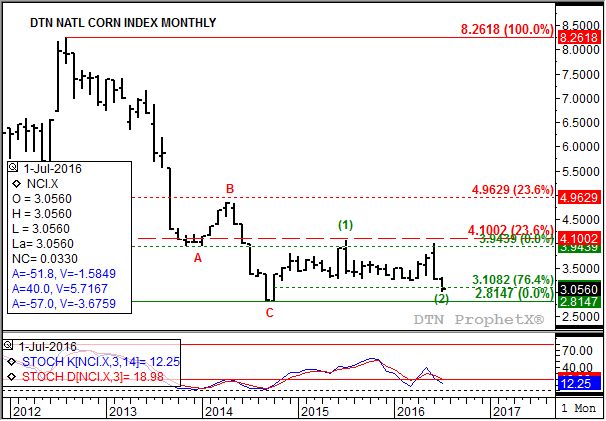
Corn (Cash): The DTN National Corn Index (NCI.X, national average cash price) closed at $3.05 1/2, down 20 3/4 cents for the month. Trends analysis is complicated in cash corn. While the argument could be made that the NCI.X remains in a major (long-term) 5-Wave uptrend, with the ongoing secondary (intermediate-term) downtrend amounting to a Wave 2 retracement, the market also looks to be in a major sideways pattern between the October 2014 low of $2.18 1/2 and the July 2015 high of $4.05 3/4. Both weekly and monthly stochastics are below the oversold level of 20%, hinting at a possible end to the Wave 2 sell-off in the coming month(s).
Corn (Futures): The more active December contract closed at $3.42 3/4, down 28 1/2 cents on the monthly chart. Trend patterns are similar to what was described in the cash corn segment, with the Wave 2 secondary (intermediate-term) sell-off continuing to hold above major (long-term) support at the October 2014 low of $3.18 1/4. Another similarity with cash corn is that December's weekly and monthly stochastics are all below the oversold level of 20%.
P[L1] D[0x0] M[300x250] OOP[F] ADUNIT[] T[]
Oats: The more active December contract closed at $1.99 1/4, down 2 1/2 cents on the monthly chart. Despite the lower monthly close the major (long-term) trend remains up. The market continues to consolidate within the April 2016 range of $2.24 3/4 to $1.81. Monthly stochastics remain bullish, meaning the market could see a topside breakout and a rejoining of its uptrend. If so, initial resistance is pegged at $2.50 1/4, a price that marks the 23.6% retracement level of the previous downtrend from $5.04 1/2 through the March 2016 low of $1.71 3/4.
Rice: The more active September contract closed at $9.94, down $0.565 on the monthly chart. The market's long-term trend remains sideways with long-term support at $9.30 and initial resistance the October 2015 high of $13.44. Monthly stochastics are neutral-to-bearish indicating continued selling interest could be seen.
SRW Wheat (Cash): The DTN National SRW Wheat Index (SR.X, national average cash price) closed at $4.72 1/2, down 39 cents for the month. The major (long-term) trend is down with support at the December 2008 low near $3.12 1/4.
HRW Wheat (Cash): The DTN National HRW Wheat Index (HW.X, national average cash price) closed at $3.19, down 13 cents for the month. The major (long-term) trend is down as the HW.X moved to its lowest level ($3.16 3/4) since the September 2005 low of $3.12 3/4. Needless to say cash HRW wheat, like the rest of the wheat complex, is sharply oversold but continues to struggle finding buying interest. National average basis at the end of July was calculated at 90 3/4 cents under the September Kansas City futures contract.
HRS Wheat (Cash): The DTN National HRS Wheat Index (SW.X, national average cash price) closed at $4.36 1/2, down 10 1/4 cents for the month. The major (long-term) trend is down as the SW.X moved to its lowest level ($4.30 1/4) since the October 2016 low of $4.29.
To track my thoughts on the markets throughout the day, follow me on Twitter:www.twitter.com\Darin Newsom

Comments
To comment, please Log In or Join our Community .