
Technically Speaking
Dec Corn: From Erosion to Tsunami to Landslide
Watching the December contract slowly but steadily grind lower these past months has been similar to watching the Colorado River slowly deepen the Grand Canyon. You know it's happening, you think you can see it happening, but in reality changes are nearly imperceptible.
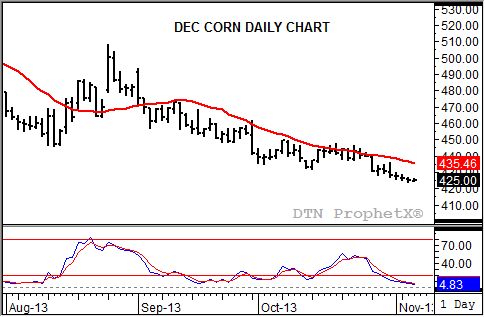
Take a look at Dec corn's daily chart. Notice that the contract just continues to work lower (top chart), slowly, but consistently as it set a new low of $4.24 Tuesday. The 20-day moving average (top study, red line) has been a constant source of pressure keeping the path of least resistance to the downside.
Going back to Monday, October 21 the daily range (price difference between the high and low price for the day, including the overnight session) for December corn has been 6 cents. In fact, the last time the contract posted a double-digit range, of exactly 10 cents, was on October 10 (10/10) oddly enough. Comparing it to its daily limit move of 40 cents one has to add up the daily ranges from November 5 through October 28 to come up with a total of 40 3/4 cents.
Again going back to Monday, October 21 there have been 11 daily closes. Of those, nine have been lower than the previous day with only two to the plus side on the close. Tuesday's settlement of $4.25 was the fifth consecutive lower close, though the contract had only lost a total of 7 cents from the $4.32 settlement posted on October 29.
Daily stochastics (bottom study), a momentum indicator, have also come to a standstill. Early Wednesday morning the faster moving blue line is calculated at 4.8% while the slower moving red line is 6.2%. Keep in mind that anything below 20% is considered oversold, and viewed (technically) as a possible buying opportunity.
The release of pre-report estimates (DTN's Report Preview will be posted Thursday, November 7) has been like a storm warning before a coming tsunami. We can all see the bearish numbers coming, capable of easily washing away what little support there is in the corn market and leading to a quick landslide of a limit down move in a matter of seconds following the release of the reports.
But there is little we can do about it now. A look at the long-term monthly chart (blog post from October 29, "'If You Give a Mouse a Cookie' Corn Could Turn Bullish Again") shows the nearby December contract trading below major technical price support at $4.77 1/4, opening the door for an extended sell-off back toward the previous low of $2.96 3/4 (September 2009). However, monthly stochastics have moved below the 20% level creating a glimmer of hope for market bulls that corn could soon see a move to an uptrend.
P[L1] D[0x0] M[300x250] OOP[F] ADUNIT[] T[]
As is always the case when facing a powerful phenomenon, take your cues from the Boy Scout's slogan and "be prepared", keeping in mind the line from the Stevie Nicks/Lindsay Buckingham song: "Well maybe the landslide will bring you down."
To track my thoughts on the markets throughout the day, follow me on Twitter: www.twitter.com\DarinNewsom

Comments
To comment, please Log In or Join our Community .