

Technically Speaking
What the Nov Jan Bean Spread Tells Us
The last week has seen countless headlines proclaiming how the grain industry is adrift without USDA as its rudder. The din could possibly reach a crescendo following Monday's announcement that there will be no October report this coming Friday. I'm sure there will be great gnashing of teeth and rending of clothes over this. But before you do, take a deep breath, say a few loud, cleansing "Ahms", and take a look at the spread charts. You'll feel better, trust me.
Those of you familiar with my analysis know the importance I place on spreads. To me spreads are the window that allows us to look into the market and see what fundamentals really are. How these spreads move, how they trend, gives us all the information we need as to the bullishness of bearishness of supply and demand. Over the next few days I will be posting a series of blogs looking at the various grains and their spreads, analyzing what the markets have to say about fundamentals unencumbered by UDSA numbers.
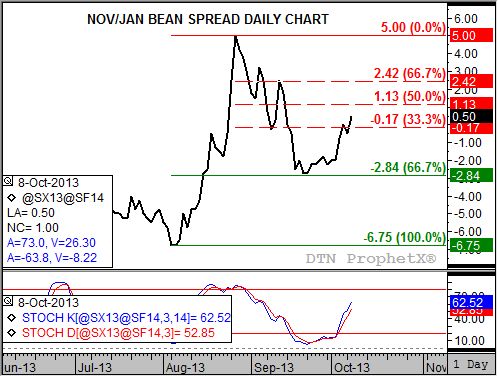
Let's start with the market that has caused the industry the most consternation of late -- soybeans. Take a look at the November to January daily spread chart, and what do you see? What direction is the spread moving, or in other words, what is its trend?
Okay, that should be long enough. The trend is clearly up. This means the November contract is gaining in price on the January contract, so much so that at the close of the Tuesday morning CME Globex session (7:45 am CT) the November held an inverse (price premium) to the January of 0.50 cents. An inverted spread, no matter how small, reflects an increasingly bullish market view of supply and demand.
What is interesting about this spread is that it has been going up ever since the release of USDA's Quarterly Stocks report on September 30. You remember that one don't you? The one where old-crop ending stocks (new-crop beginning stocks) surprisingly jumped to 141 mb when all logic, and simple math, indicated a decrease in stocks to about 110 mb? At the time of the report the November to January spread was trading at a carry (January higher priced than the November) of 2.25 cents. Throwing out all the noise the September 30 report created, the market's belief of a tighter supply and demand situation has only strengthened.
Since we are analyzing trend in spreads, we can apply our usual technical tools. Notice that the November to January spread posted a strong downtrend from its high of a 5.00 cent inverse (August 27) to the low of a 2.75 cent carry (September 23). Not only did this low occur a full week before USDA's reports, it was also a test of technical support at the 67% retracement level of the previous uptrend from the low of 6.75 cent carry (August 5) through the 5.00 cent inverse August 27 high.
So where do we go from here? Daily stochastics (bottom study) show the spread to be in an uptrend and testing resistance between (roughly) 0.25 cent inverse and 1.25 cent inverse. These levels mark the 33% and 50% retracements of the recently concluded downtrend. Given the momentum of the market, it would not be surprising to see the spread stretch to the 67% retracement level of almost 2.50 cent inverse.
So what does this mean fundamentally? The soybean market is well aware of how short supplies really are. In an effort to generate cash sales at harvest, commercial traders could push the nearby contract just enough to get their hands on supplies to meet demand. However, gains in the November to January spread could be limited by the very same harvest, leaving the real work to be done by the January to March, March to May, and May to July spreads. Keep in mind that despite recent downturns, all three of these spreads continue to show an inverse as well.
P[L1] D[0x0] M[300x250] OOP[F] ADUNIT[] T[]
To track my thoughts on the markets throughout the day, follow me on Twitter: www.twitter.com\Darin Newsom
Commodity trading is very complicated and the risk of loss is substantial. The author does not engage in any commodity trading activity for his own account or for others. The information provided is general, and is NOT a substitute for your own independent business judgment or the advice of a registered Commodity Trading Adviser.

Comments
To comment, please Log In or Join our Community .