

Technically Speaking
Consolidating Dec Mar Corn
To the casual observer, watching the corn market is similar to watching a sloth race. Neither the futures market nor the futures spreads show much movement, leading one to question whether or not they are even alive. But if you look closely, both are showing just enough signs of life to make them interesting analytical studies.
I'll return to the futures market another day. For now, with USDA reports on hiatus, let's look at what the December to March futures spread is telling us about the market's fundamentals.
P[L1] D[0x0] M[300x250] OOP[F] ADUNIT[] T[]
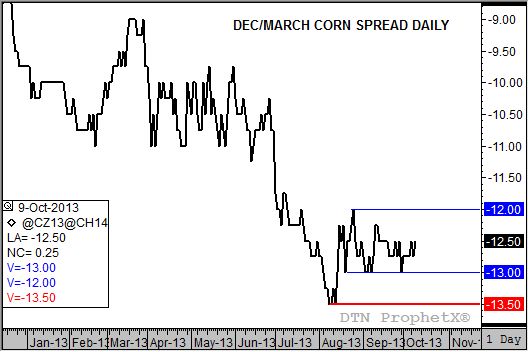
Take a look at the daily chart for the nearby new-crop spread, otherwise known as the Dec to March. Note that since late August the carry in the spread has held between 12 cents (upper blue line) and 13 cents (lower blue line). Just before this consolidation began the spread had reached a low of 13.50 cents carry. To refresh your memory, a futures spread showing a carry (or contango, same thing) means that the deferred contract is higher priced than the nearby contract. The larger the premium the deferred contract holds, the more bearish the market's supply and demand situation is. Also, my charts trend down as the carry gets larger as it shows the price of the nearby contract less the price of the next deferred contract. Conversely, it would trend up if the carry was weakening or the inverse (nearby contract higher priced than the deferred contract) was strengthening (see Tuesday's blog regarding the Nov/Jan bean spread).
Turning back to corn, it recently looked like the spread was going to push through its support at 13 cents to test the previous low of 13.50 cents. However, enough commercial buying came back to the market to take it off the support level, rallying it a modest 0.50 cent to a carry of 12.50 cents. Keep in mind this happened before news of a new sale to China hit the wire.
In the grand scheme of things, a 0.50 cent rally is not a big deal. As this chart suggests, the Dec to March spread is a long way from establishing an uptrend with a bullish breakout above the 12.00 cent carry mark. Given that harvest is ramping up, and some new-crop sales will be made right off the combine, it would be surprising for the spread to do much over the coming weeks. However, if we do see a move, either bullish or bearish, it will give us the information we need as to the market's changing opinion on the 2013 harvest.
Stay tuned.
To track my thoughts on the markets throughout the day, follow me on Twitter: www.twitter.com\DarinNewsom

Comments
To comment, please Log In or Join our Community .