Fundamentally Speaking
Seasonal Soybean/Corn Ratio Studies
The funds are long soybeans and short corn, and given the underlying fundamentals, this appears to be a decent strategy. The situation for corn is not cheery whatsoever with perhaps the only bullish factor being the possibility that the huge weather problems seen in the Northwest Corn Belt over the past few weeks will result in lower output. The final production report is expected 1/10/2020, with possible decreases expected from lower harvested acreage and yields.
The demand side of the equation remains desultory as ever and this includes exports, feed and industrial offtake. Furthermore, a likely large expansion in U.S. corn acreage next spring could bring 2020/21 ending stocks up over 2.70 billion bushels.
P[L1] D[0x0] M[300x250] OOP[F] ADUNIT[] T[]
As for soybeans, much depends on the Chinese trade situation but with ending stocks close to half year ago levels. Current exports show at least in pace with the current 1.775 billion-bushel projection the price prospects for this commodity seem brighter. It would seem the function of the soybean market is to make sure the price is attractive enough on a relative basis to corn to attract enough acreage to ensure stocks next year do not fall to exceptionally low levels.
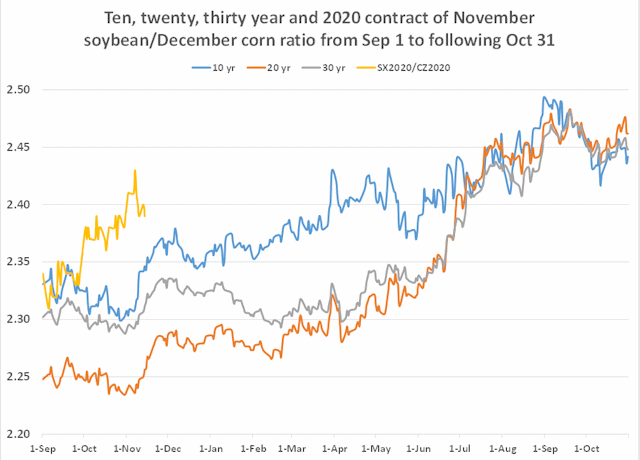
One indicator that certainly will be watched is the new crop November soybean/December corn ratio. The 2020 contract closed today at 2.39 which is just below the SX2019/CZ2019 ratio of 2.40 and is close to the long-term average of 2.36. A figure over this level is seen encouraging increased soybean area over corn and vice-versa.
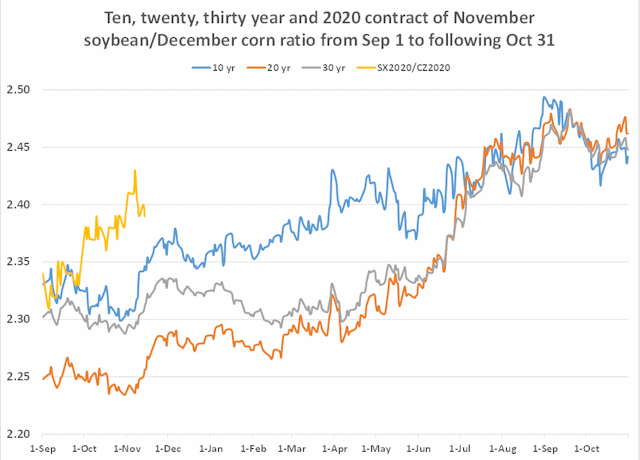
This graphic shows the 10, 20 and 30 year seasonal of the November soybean/December corn ratio from September 1st of the prior year to the following October 31st, the first notice day of the November soybean contract. We also plot the SX2020/CZ2020 ratio from September 1, 2019 to the present.
All three longer term seasonals show the ratio weakening from September 1 to the last week of October, probably linked to more soybean harvest pressure in the September/October timeframe than corn. Then the ratio basically increased from the middle of November to the end of August before the ratio weakens during September and October for the reason we just cited.
A couple of observations are the recent strength in soybeans over the past few years has the 10-year ratio tracking higher than the 20 or 30 year seasonal and the 2020 SX/CZ ratio is starting the uptrend at much higher levels than all three seasonal price patterns.
(KLM)
© Copyright 2019 DTN/The Progressive Farmer. All rights reserved.


Comments
To comment, please Log In or Join our Community .