
Fundamentally Speaking
IL & IA Soybean Acreage, Yield and Production
In a prior piece we noted that in Illinois and Iowa, long the top two corn producing states, had seen their share of U.S. corn harvested acreage and production decline since 2000 with the percent drop in output less than that of the acreage decline based on both Illinois and Iowa corn yields improving relative to the national yield.
In this piece we do the same thing except using soybeans as again for a number of years, both Illinois and Iowa have been numbers one and two as the top soybean producing states.
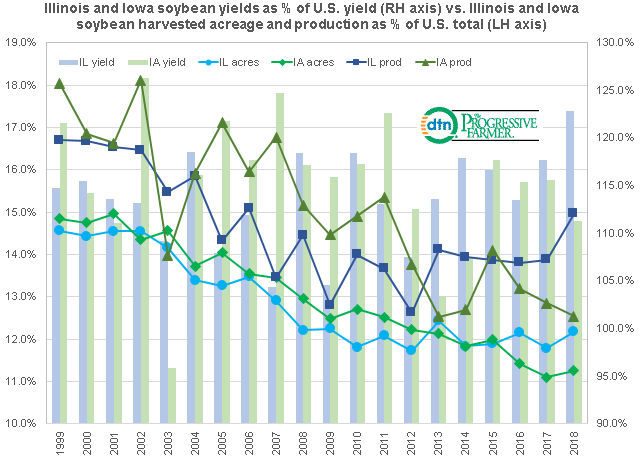
This graph shows Illinois and Iowa soybean yields as a percent of the U.S. yield on the right hand axis vs. Illinois and Iowa soybean harvested acreage and production as a percent of the U.S. total on the left hand axis.
The data range is from 2000 to the 2018 November crop production estimates.
We looked at the change two ways, the first looking at 1999 harvested acreage, production and yields in both states compared to the November 2018 figures and then looking at the 1999-2003 average for all variables vs. the 2014-2018 averages.
With regard to harvested acreage, just using the 1999 and 2018 figures, the Illinois share fell from 14.6% to 12.2%, a 16.4% drop while in Iowa it went from 14.8% to 11.3%, which is a 24.2% tumble.
P[L1] D[0x0] M[300x250] OOP[F] ADUNIT[] T[]
Comparing the 1999-2003 average vs. the 2014-2018 average, the Illinois share of U.S. harvested soybean acreage fell from 14.5% to 12.0%, off 17.2%, while in Iowa it went from 14.7% to 11.5%, down 21.6%.
For production, just using the 1999 and 2018 figures, the Illinois share fell from 16.7% to 15.0%, a 10.4% drop while in Iowa it went from 18.0% to 12.5%, which is a 30.5% tumble.
Comparing the 1999-2003 average vs. the 2014-2018 average, the Illinois share of U.S. soybean production fell from 16.4% to 14.1%, off 13.9%, while in Iowa it went from 16.7% to 13,1%, down 21.8%.
Finally for yields, in 1999 the Illinois yield was 14.8% above the U.S. figure while in 2018 it was 22.8% above the national market.
For Iowa in 1999 it was 21.6% above the U.S. yield but only 11.3% above the national figure in 2018.
Yield comparison is probably better represented by looking at the percent change between the two five year periods.
In that regard, from 1993 to 2003, the Illinois yield averaged 13.2% above the U.S. figure while in the 2014-18 period it averaged 17.5% above the U.S. yield, a 3.9% increase.
In Iowa, from 1993 to 2003, the yield averaged 13.8% above the U.S. figure while in the 2014-18 period it averaged 13.5% above the U.S. yield, actually a 0.3% drop.
Putting all of this together, it appears that while the share of Illinois and Iowa soybean harvested acreage and production of the U.S. totals has declined for both states over the past 20 years, Iowa's share of each, which at one point was higher than Illinois, had dropped below its neighboring state and while the Illinois yield as a percent of the U.S. figure has increased by about 4%, in Iowa it has stayed essentially unchanged.
A final point is that each state's share of soybean harvested acreage and production as a percent of the U.S. total has dropped even faster than each state's share of corn harvested acreage and production.
Over the past 20 years, soybean plantings have really expanded in areas of the Upper Midwest and Plains and also in the Southeast and Delta based on better seed genetics and superior returns relative to other crops that were often planted in these regions.
(KR)
© Copyright 2019 DTN/The Progressive Farmer. All rights reserved.

Comments
To comment, please Log In or Join our Community .