Fundamentally Speaking
Iowa Sees 2nd Highest Corn Yield Ever
The recently released November crop production report did show a record U.S. corn yield and the second highest soybean yield ever.
This was achieved despite less than stellar growing conditions.
Certainly helping was ample subsoil moisture levels at the beginning of the year and for much of the summer below average temperatures that helped conserve soil moisture and alleviate any moisture stress on the corn and soybean plants.
Still, based on the low weekly crop ratings relative to other high yielding seasons, especially the most recent in 2016 there is a lot of head scratching as to how these yields were achieved.
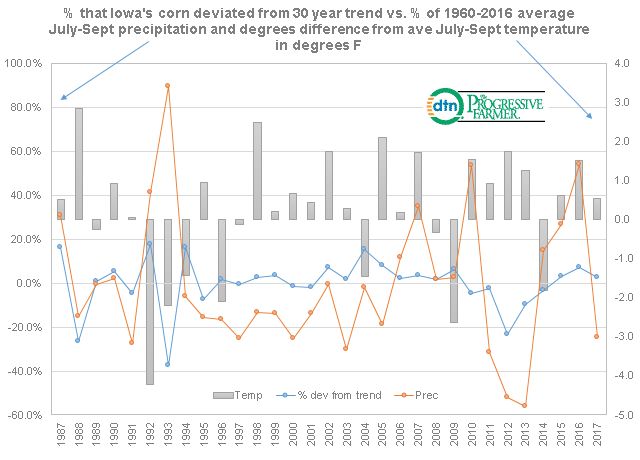
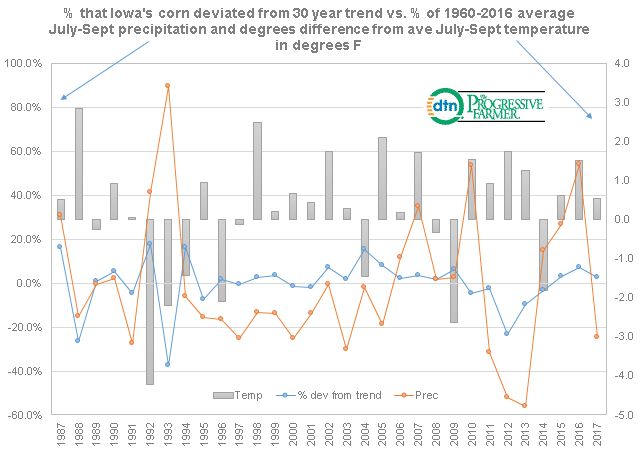
Along these lines, we look at corn yields in Iowa which is the top producing state since 1987, specifically the percent that each year's actual corn yield deviated from the 30-year trend yield for corn vs. the percent that each year's July-September total rainfall was as a percent of the 1960-2017 average which is 11.81 inches of rain.
P[L1] D[0x0] M[300x250] OOP[F] ADUNIT[] T[]
We also look at the average July-September temperature to see how many degrees that differed from the average 1960-2017 July-September reading of 69.2 degrees Fahrenheit.
The percent of yield deviation and the percent of average precipitation are plotted on the left hand axis with the temperature difference plotted on the right hand axis.
This year's Iowa corn yield as indicated in the November crop report was 197 bushels per acre (bpa), the second highest ever next to the year ago 203 bpa.
This was 2.6% ahead of the 30-year trend yield which this year is 191.96 bpa.
Turning to the weather variables, this year's average July-September temperature for Iowa was 69.7 degrees, 0.5 above the 69.2 average which is below the year ago 70.7 reading and actually the second lowest since 2009 with the 67.3 reading in 2014 the only one lower in recent seasons.
As for precipitation, the 2017 July-September total for Iowa was 8.90 inches which is 75.4% of the 11.81 inch average or 24.6% below the average.
Last year's rainfall was a whopping 18.18 inches which is more than double this year's total, but from 2011 to 2013, Iowa had three straight July-September rainfall totals of 68.6%, 48.0% and 43.8% of the 11.81 inch average.
Putting all of this together it appears that Iowa weather in the July-September period featured average temperatures and slightly below average precipitation.
Looking at similar years, we see 1991 with yields 4.5% below trend, summer rainfall 27.5% below average; 1997 with yields at trend with rainfall 25.3% below average; 2000 when yields were 1.8% below trend with rainfall 25.3% below average; 2003 with yields 1.5% above trend with rainfall 30.1% below average; and 2011 with yields off 2.2% from trend with rainfall 31.4% below average.
All these years had temperatures less than one degree above average so there have been times in the past when similar weather conditions have resulted in above trend corn yields for Iowa.
(KA)
© Copyright 2017 DTN/The Progressive Farmer. All rights reserved.


Comments
To comment, please Log In or Join our Community .