

Fundamentally Speaking
2016 Commodity Winners, Losers
As opposed to 2015 when the economic deceleration in China resulted in most commodity values losing ground, a recovery in demand this year by China, the largest commodity consuming nation in the world, and some economic stabilization in Japan and the European Union, has most markets ending higher in prices as of December 22nd than when the year started.
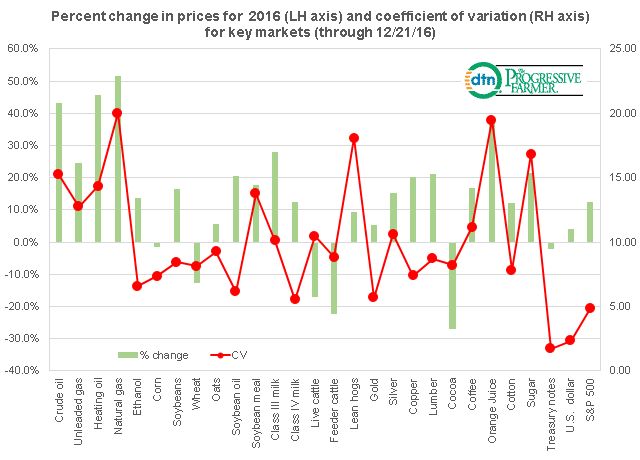
This graphic shows the net percent price move for a number of key commodities and indices for 2016 along with a measure of price volatility called the coefficient of variance (CV) which is the standard deviation of the year's price movements divided by the annual average.
P[L1] D[0x0] M[300x250] OOP[F] ADUNIT[] T[]
The stronger global economy helped give the energy complex a boosted aided by the late year OPEC production cut with crude oil up 43.1% and unleaded gasoline advancing by 24.4%.
Heating oil and natural gas, supported also by the December artic air blast in much of the country had the best gains of any of the commodities tracked, up 45.8% and 51.7% respectively.
Supported by a tightening world vegetable oil market, soybean oil posted the best advance of the grain and oilseeds complex up 20.4% with soybean meal 17.6% higher.
Corn and wheat were lower in value to end the year as they along with both feeder and live cattle and cocoa which posted the largest decline of 27.0% were really the only losers for the year.
Commodities showing the great price volatility as evidenced by a high CV include natural gas, lean hogs, orange juice and sugar while the key financial markets of the U.S. 10 year notes, the dollar and the S&P showed the least price volatility for though Treasury yields, the greenback and stock markets all posted increases, they did so in a measured way.
(KA)

Comments
To comment, please Log In or Join our Community .