

Fundamentally Speaking
Current Soybean Price Defies Fundamentals

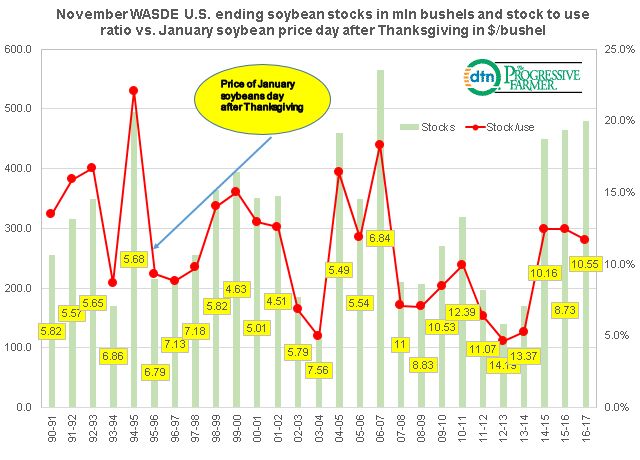
The accompanying graphic shows U.S. soybean ending stocks in million bushels and those supplies as a percent of total demand as indicated in the USDA's November WASDE report, while at the bottom is the price of January soybeans the day after Thanksgiving in dollars per bushel.
The current 480 million bushel carryout is the highest for the November WASDE since a 566 million figure was posted in the 2006/07 season, and with this year's consumption pegged at a record 4.108 billion bushels, this results in a stocks-to-use ratio of 11.7%. While this is below the past two November WASDE ratios of 12.4% it is still the loftiest since the 2006/07 season.
P[L1] D[0x0] M[300x250] OOP[F] ADUNIT[] T[]
Hence, the current soybean rally seems at odds with fundamentals that are overwhelmingly bearish yet the current January price of $10.55 per bushel is more than $1.80 above the year ago price.
Reasons for this include huge fund buying of soybeans as a lot of commodities are being carried higher along with most stock market indices in a so called "Trump rally" while the pace of our overseas sales of soybeans has been robust, especially to China.
Adding to the gains has been the ongoing rally in soybean oil linked to a tighter global vegoil situation and increased biodiesel targets announced last week by the USDA.
Finally, we suspect the market's cognizance that the USDA is notorious for under-estimating final total demand for U.S. soybeans which we will cover in a future post is also quite supportive.
(KA)
© Copyright 2016 DTN/The Progressive Farmer. All rights reserved.
Comments
To comment, please Log In or Join our Community .