

Fundamentally Speaking
Comparing 2016 to Other High-Yield Corn Years
How big is big?
That is the question traders will be asking themselves heading into the August 12th USDA crop production report.
With generally favorable weather all growing season, historically high crop ratings and now pictures flying around the Internet of fabulous looking corn it appears that the only question is how far above the prior 171.0 bushel per acre (bpa) set in 2014 will the USDA estimate the 2016 national corn yield.
P[L1] D[0x0] M[300x250] OOP[F] ADUNIT[] T[]
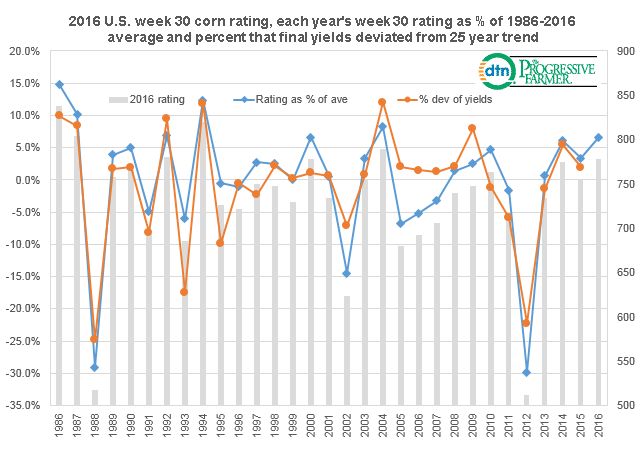
To help answer that question the accompanying graphic shows the week 30 (end of July-beginning of August) crop rating [using a system where we weight the crop based on the percent in each category and assign that category a factor of 2 for very poor, 4 for poor, 6 for fair, 8 for good, and 10 for excellent and then sum the results] as the 2016 week 30 (end of July-beginning of August) rating is 778 and plotted on the right hand axis. On the left hand axis is each year's week 30 rating as a percent of the 1986-2016 average and the percent that final corn yields deviated from the 25 year trend.
As an example, the 1986-2016 average for week 30 conditions is 730 so the 2015 week 30 rating of 754 is 3.3% above the average as plotted by the blue line.
This year's 778 rating is 6.6% above the average which is tied for sixth best with the year 2000.
The only years where that respective week 30 crop corn condition rating was higher than this year was in 2004 at 8.3% above the average, 1994 at 12.4% above the average, 1992 at 6.9% above the average, 1987 at 10.8% above the average and in 1986 at 14.8% higher than the average.
Needless to say these five other stellar years, 1986, 1987, 1992, 1994 and 2004 are also seasons when the final corn yield was well above trend at 10.0%, 8.4%, 9.5%, 11.9% and 12.1% above trend respectively and needless to say these were all record yielding years.
The only other records were in 2009 when the rating was 2.5% above the average and final yields were 7.9% above trend and in 2014 when the rating was 6.1% above the average and final yields were 5.5% above trend.
Note there is an 86% correlation rate between the crop rating averages and the percent final yields deviate from the 25 year trend. Looking at the data we can say that while the 2016 U.S. corn crop is perhaps better than the record yielding seasons of 2000 and 2014 it is not as good as those seen in the years 1986, 1987, 1992, 1994 and 2004 when final yields averaged 10.3% above trend.
(KA)

Comments
To comment, please Log In or Join our Community .