

Fundamentally Speaking
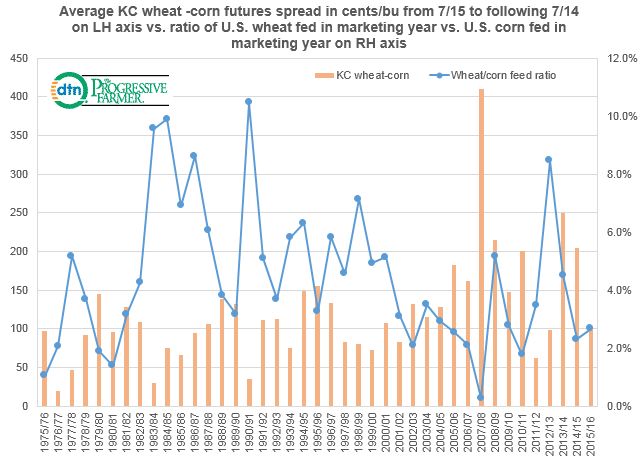
Wheat-Corn Spread vs. Amount Fed
Diverging fundamentals for corn and wheat is resulting in the narrowed spread differential between Kansas City wheat and corn futures.
The U.S. is in the process of harvesting a monster winter wheat crop with record yields adding to plentiful global supplies and this has Kansas City wheat futures pinned close to ten year lows.
On the other hand, a severe late season drought in Brazil has kicked a large amount of global corn business back to the U.S. at a time when trepidation about upcoming weather during corn's critical pollination period is reaching feverish levels.
As result, the current spread between the continuous Kansas City wheat and corn futures spread has narrowed in to an unusually tight 22 cent premium of wheat over corn.
Looking at the monthly charts, it appears this is the third lowest premium in the past 30 years with corn actually premium to KC wheat back in June 2013 and again in April 2012.
What this has done is increase the attractiveness of including wheat in the feed rations with reports of heavy wheat feeding occurring in the cattle areas of the Plains and poultry regions in the Southeast.
P[L1] D[0x0] M[300x250] OOP[F] ADUNIT[] T[]
This got us thinking about how much corn is fed vs. wheat in years when wheat is relatively low priced vs. corn.
First note that the wheat marketing year goes from June 1 to May 31 while the corn marketing year goes from September 1 to August 31.
To split the marketing years we looked at the daily KC wheat- corn spread from July 15 to the following July 14 with the average annual spread reported on the left hand axis in cents per bushel. The ratio of the amount of wheat fed vs. the amount of corn fed is tracked on the right hand axis.
One would think that there would be some relation between the KC wheat-corn spread and the amount fed of each and there is with a correlation of 48%.
For example back in the 1983/84 season, a drought caused corn prices to rally sharply where the average spread between KC wheat and corn that year was a relatively narrow 30 cents.
The amount of wheat fed that year as 371 million bushels and the amount of corn fed was 3.876 billion resulting in a ratio of 9.6% which is pretty high and was even higher in the 1990-91 season at 10.5%, a year when KC wheat prices only averaged a 35 cent premium per bushel over corn.
Conversely, in the 2007/08 season, wheat was hugely expensive vs. corn with an average premium that season of $4.11 per bushel over corn.
That year only 16 million bushels worth of wheat was fed vs. 5.913 billion of corn resulting in a wheat/corn feed ratio of 0.03%.
In the latest WASDE report, USDA is forecasting 5.550 billion bushels worth of corn will be fed, the highest figure in nine years and a stout 300 million bushels above this year.
On the other hand, USDA is pegging wheat feed use at 200 million bushels, only 60 million above last year even with very low wheat vs. corn prices.
When all is said and done, we think wheat feed use will be higher than 200 million bushels and corn feed use lower than the projected 5.550 billion.
(KA)
© Copyright 2016 DTN/The Progressive Farmer. All rights reserved.

Comments
To comment, please Log In or Join our Community .