

Technically Speaking
Veg Oil Prices Finding Possible Support After 3-Month Pullback
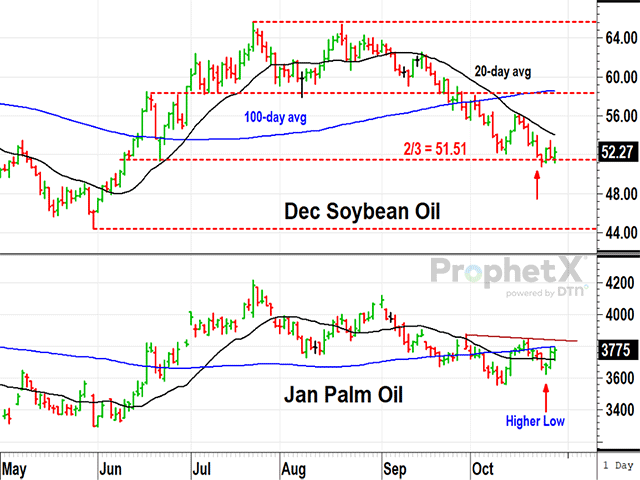
SOYBEAN OIL:
After a bullish summer of trading higher, helped by record amounts of soybean oil being used to make biofuels, December soybean oil prices peaked at 65.58 cents a pound on July 24, failed a challenge of the high on Aug. 21 and broke support near 58 cents on Sept. 25. Since then, prices fell to a low of 50.82 on Oct. 24 and finished the week ended Oct. 27 down 1.12 cents at 52.27. Technically speaking, there is an interesting symmetry taking place as the correction since the July 24 peak has retraced two-thirds of the original 21.11-cent rally from the May 31 low of 44.47 cents. The 90-day correction is also two-thirds longer than the original 54-day rally. Setting mathematical curiosity aside, the trend remains down, but a close above the 20-day average near 54 cents, if it happened, would signal a bullish change in short-term momentum, adding to prices' bullish possibilities. Clues in palm oil below are also significant for soybean oil.
P[L1] D[0x0] M[300x250] OOP[F] ADUNIT[] T[]
PALM OIL:
As the world's largest source of vegetable oil, palm oil prices tend to have a strong influence on the sector and, for that reason, are also important clues for soybean oil prices. Like soybean oil, January Malaysian palm oil prices have also corrected back from their 54-day rally, which peaked on July 24 at 4,215 ringgits, but don't have quite the same mathematical symmetry as seen in soybean oil. What is interesting is that January palm oil posted a low of 3,558 ringgits on Oct. 10 and have traded higher since, leaving behind a higher low of 3,623 on Oct. 25 and finished Oct. 27 at 3,775. A clear close above 3,830, if it happened would signal a bullish change in momentum, if it happened, breaking above the 100-day average near 3,800 and the neckline of a head-and-shoulders formation near 3,830. Until that happens, prices remain in a bearish trend with bullish potential.
Todd Hultman can be reached at Todd.Hultman@dtn.com
Follow him on X, formerly Twitter, @ToddHultman1
The comments above are for educational purposes only and are not meant as specific trade recommendations. The buying and selling of commodities, futures or options involve substantial risk and are not suitable for everyone.
(c) Copyright 2023 DTN, LLC. All rights reserved.

Comments
To comment, please Log In or Join our Community .