Technically Speaking
March Corn Turns Lower to Start New Year
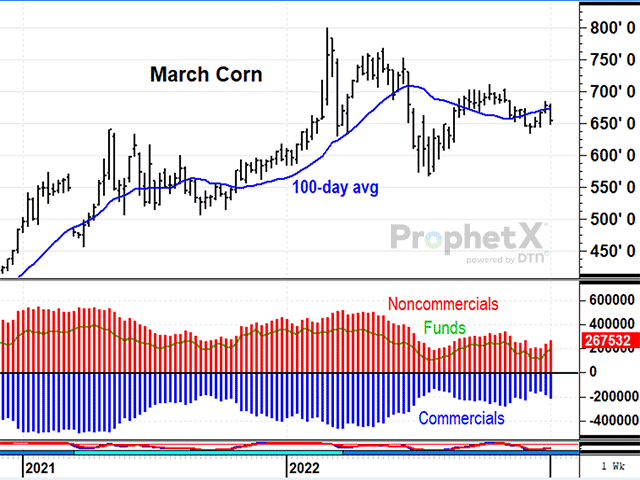
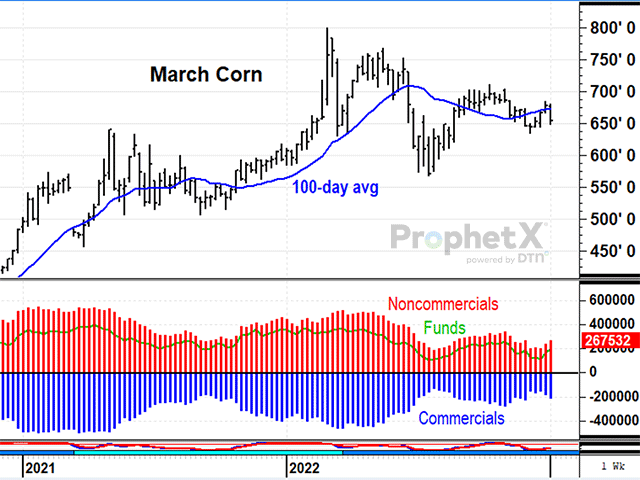
March corn fell 24 1/2 cents in the week ended Friday, Jan. 6, to $6.54 a bushel, back below the 100-day average at $6.72 and near its lowest prices in over four months. March corn finished 2022 at $6.78 1/2, a modest gain in December that put prices above the 100-day average, but not for long. Ongoing concerns about lower export sales and questionable demand for ethanol production made it difficult for corn to support the higher prices. Technically speaking, last week's sell-off was a bearish change in momentum and left behind a third lower high since corn's peak back in May. Adding to the selling pressure, Friday's Commitments of Traders report showed noncommercials holding 267,532 net longs in corn, a large position that is now under pressure to liquidate. Unless something can change to put March corn back above last week's high of $6.85, corn's bearish momentum is apt to take prices lower in early 2023.
ETHANOL:The cash price of ethanol in Chicago fell 10 1/2 cents in the week ended Jan. 6 to $2.225 a gallon, staying below its 100-day average at $2.44 for a seventh consecutive week. The U.S. Energy Department reported the previous week's ethanol production fell to 844,000 barrels per day (bpd), the lowest since February 2021, a similar time that experienced a disruptive polar vortex. Since Sept. 1, ethanol production has stayed even with last year's pace, but there are concerns about a slower pace of gasoline demand. Technically speaking, ethanol prices remain under bearish pressure and are a bearish influence on corn prices -- not unusual for this time of year. A bullish turn in the weekly stochastic coincided with the $2.09 low in December, but it remains to be seen if prices will be able to hold above that low.
P[L1] D[0x0] M[300x250] OOP[F] ADUNIT[] T[]
March RBOB gasoline dropped 22.68 cents to $2.2515 in the week ended Jan. 6, taking prices from above the 100-day average at $2.37 to below the average, the second failed rally attempt in two months. The U.S. Energy Department reported U.S. gasoline supplies fell to 222.7 million barrels as of Dec. 30, the lowest in over 10 years. Since Sept. 1 however, gasoline demand was down 7% from a year ago, resulting in mixed fundamental messages. Technically speaking, March gasoline has been under bearish pressure since July; but downward momentum may be changing. The weekly stochastic shows bullish divergence after prices rallied off the Dec. 12 low of $2.0488. It remains to be seen if prices can sustain a rally, but another close above $2.43, if it happened would be a sign of weakening resistance and allow for a bullish change of trend.
**
Comments above are for educational purposes only and are not meant as specific trade recommendations. The buying and selling of grain or grain futures or options involve substantial risk and are not suitable for everyone.
Todd Hultman can be reached at Todd.Hultman@dtn.com
(c) Copyright 2023 DTN, LLC. All rights reserved.


Comments
To comment, please Log In or Join our Community .