

Technically Speaking
Monthly Analysis: Energy Markets
Brent Crude Oil: The spot-month contract closed at $47.92, down $2.39 on the monthly chart. The major (long-term) trend remains down following the bearish crossover by monthly stochastics above the overbought level of 80% at the end of March. Next support is at $42.73, a price that marks the 50% retracement level of the previous uptrend from $27.10 (January 2016) through the high of $58.37 (January 2017). The 677% retracement level is down at $37.51.
Crude Oil: The spot-month contract closed at $46.04, down $2.28 on the monthly chart. The major (long-term) trend remains down following the bearish crossover by monthly stochastics above the overbought level of 80% at the end of March. Next support is at $44.09, a price that marks the 38.2% retracement level of the previous uptrend from $26.05 (February 2016) through the high of $55.24 (January 2017). The 50% retracement level is down at $40.65.
P[L1] D[0x0] M[300x250] OOP[F] ADUNIT[] T[]
Distillates: The spot-month contract closed at $1.4755, down 3.98cts on the monthly chart. The major (long-term) trend remains down following the bearish crossover by monthly stochastics above the overbought level of 80% at the end of March. Initial support is at $1.4148, a price that marks the 38.2% retracement level of the previous uptrend from $$0.8487 (January 2016) through the high of $1.7647 (January 2017). The 50% retracement level is down at $1.3067.
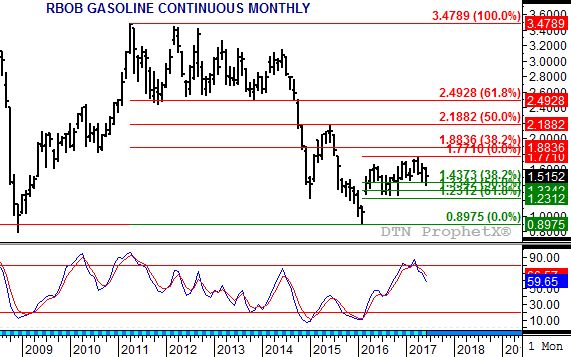
Gasoline: The Chicago cash RBOB market closed at $1.5152, down 9.70cts on the monthly chart. The market looks to be in a major (long-term) sideways trend between support at $1.4373 and resistance at the April high of $1.7710. Monthly stochastics are bearish, but did not establish a crossover above the 80% mark. Therefore, it would not be surprising to see the market rally toward the high end of its sideways range.
Ethanol: The spot-month contract closed at $1.509, down 1.5cts on the monthly chart. The major (long-term) trend remains sideways. Resistance is at $1.712, a price that marks the 23.6% retracement level of the previous downtrend from $3.07 (July 2011) through the double-bottom low of $1.292 (January 2015 and January 2016). Support is at the double-bottom low.
Natural Gas: The spot-month contract closed at $3.035, down 3.6cts on the monthly chart. Natural gas remains in a 3-wave downtrend with the February 2017 low of $2.522 the bottom of Wave A (first wave). The May high of $3.431 was not only a test of resistance at $3.432, the 61.8% retracement of Wave A, but also the peak of Wave B. Wave C would now be expected to move below the Wave A low.
Propane (Conway cash price): Conway propane closed at $0.5550, down 4.25cts on its monthly chart. The major (long-term) trend remains down following the bearish reversal posted during February. Next support is at $0.4714, a price that marks the 67% retracement level of the previous uptrend from $0.2525 through the February high of $0.9100.
To track my thoughts on the markets throughout the day, follow me on Twitter: www.twitter.com\DarinNewsom

Comments
To comment, please Log In or Join our Community .