
Technically Speaking
Monthly Analysis: Energy Markets

Brent Crude Oil: The spot-month contract closed at $51.73, down $1.10 on the monthly chart. The major (long-term) trend remains down following the bearish crossover by monthly stochastics above the overbought level of 80% at the end of March. Initial support is at the 4-month low of $49.71, then $47.96. The latter marks the 33% retracement level of the previous uptrend from $27.10 (January 2016) through the high of $58.37 (January 2017). The 50% retracement level is down at $42.73.
Crude Oil: The spot-month contract closed at $49.33, down $1.27 on the monthly chart. The major (long-term) trend remains down following the bearish crossover by monthly stochastics above the overbought level of 80% at the end of March. Initial support is at the 4-month low of $47.01, then $44.09. The latter marks the 38.2% retracement level of the previous uptrend from $26.05 (February 2016) through the high of $55.24 (January 2017). The 50% retracement level is down at $40.65.
P[L1] D[0x0] M[300x250] OOP[F] ADUNIT[] T[]
Distillates: The spot-month contract closed at $1.5040, down 6.96cts on the monthly chart. The major (long-term) trend remains down following the bearish crossover by monthly stochastics above the overbought level of 80% at the end of March. Initial support is at the 4-month low of $1.4758, then $1.4148. The latter marks the 38.2% retracement level of the previous uptrend from $$0.8487 (January 2016) through the high of $1.7647 (January 2017). The 50% retracement level is down at $1.3067.
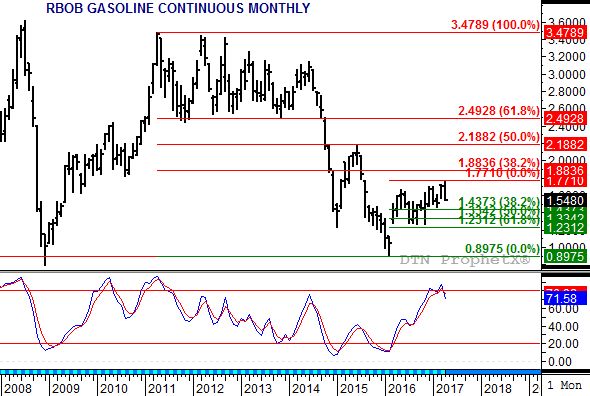
Gasoline: The spot-month contract closed at $1.5480, down 15.21cts on the monthly chart. The market posted a bearish reversal during April with the spot-month contract trading outside the March price range before closing lower. Not only was the April settlement below the March, it was also below the previous month's low of $1.56233. This would indicate the major (long-term) trend has turned down, despite the fact monthly stochastics posted a bearish crossover below the overbought level of 80%. Support is between $1.4373 and $1.2312, prices that mark the 38.2% and 61.8% retracement levels of the previous uptrend from $0.8975 (February 2016) through the high of $1.7710 (April 2017).
Ethanol: The spot-month contract closed at $1.558, down 5.6cts on the monthly chart. The major (long-term) trend remains sideways. Resistance is at $1.712, a price that marks the 23.6% retracement level of the previous downtrend from $3.07 (July 2011) through the double-bottom low of $1.292 (January 2015 and January 2016). Support is at the double-bottom low.
Natural Gas: The spot-month contract closed at $3.276, up 8.6cts on the monthly chart. Natural gas has a difficult long-term monthly chart that is indicating a possible major uptrend and downtrend at the same time. The key could be February's new 4-month low of $2.522. While a test of support at $2.521, the fact it went below previous lows seen at the end of November 2016 ($2.546) and $2.523 (August 2016) would imply the market is actually in a 3-wave downtrend with the February 2017 low the bottom of Wave A (first wave). If so, the rally in March and April to test resistance between $3.258 and $3.432 looks to be part of Wave B. This could extend during May before peaking and moving to Wave C.
Propane (Conway cash price): Conway propane closed at $0.5818, up 2.93cts on its monthly chart. The major (long-term) trend remains down following the bearish reversal posted during February. Cash propane remains is holding near support at $0.5813, a price that marks the 50% retracement level of the previous uptrend from $0.2525 through the February high of $0.9100. The 67% retracement level is down at $0.4714.
To track my thoughts on the markets throughout the day, follow me on Twitter: www.twitter.com\DarinNewsom
Comments
To comment, please Log In or Join our Community .