
Technically Speaking
Monthly Analysis: Grain Markets
Corn (Cash): The DTN National Corn Index (NCI.X, national average cash price) closed at $3.15 1/4, up 13 3/4 cents for the month. The move to a new monthly low close of $2.83 3/4 continues to indicate the major (long-term) trend is down, with the subsequent rally tied to the market's ongoing secondary (intermediate-term) uptrend. That being the case the NCI.X could test resistance between $3.17 1/2 and $3.23 1/2 before turning lower again.
Corn (Futures): The March contract closed at $3.52, up 3 1/2 cents on the monthly chart. The market's long-term monthly chart remains a mix of signals with the last major crossover by stochastics bullish (October 2014) followed by a move to a new low of $3.14 3/4 (August 2016). Also, the March contract posted a new 4-month high of $3.64 3/4, a signal that could also be considered bullish (based on the 4-month rule). This could lead to continued buying in the market.
P[L1] D[0x0] M[300x250] OOP[F] ADUNIT[] T[]
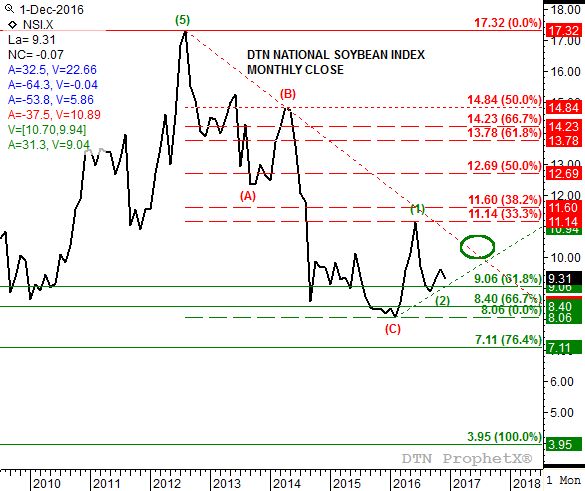
Soybeans (Cash): The DTN National Soybean Index (NSI.X, national average cash price) closed at $9.31, down 29 cents for the month. The NSI.X still looks to be in a 5-wave uptrend with the October low of $8.77 3/4 the bottom of Wave 2. In a normal uptrend Wave 3 would surpass the peak of Wave 1, which in this case is the high of $11.12 from June 2016. For now though resistance and support at long-term trendlines continue to converge with an August 2017 crossing point near $9.85.
Soybeans (Futures): The March contract closed at $10.04, down 28 1/4 cents on the monthly chart. While the market remains in a major (long-term) 5-Wave uptrend, it continues to consolidate between resistance near $10.67 1/4 and support near $9.30 1/4. The former is the 23.6% retracement level of the previous major downtrend from $17.89 (September 2012) through $8.44 1/4 (November 2015) with the latter the 76.4% retracement level of Wave 1 from the $8.44 1/4 low through the high of $12.08 1/2 (June 2016). Weekly stochastics remain neutral, with the previous major crossover bullish at the end of January 2016.
SRW Wheat (Cash): The DTN National SRW Wheat Index (SR.X, national average cash price) closed at $3.65, up 19 cents for the month. It could be argued that the major (long-term) trend is up, with monthly stochastics bullish below the oversold level of 20%. The SR.X could confirm this with a move to a new 4-month high beyond $3.76 1/2 from October 2016.
SRW Wheat (Futures): The March Chicago contract closed at $4.08, up 5 1/4 cents for the month. Until the market can break out of last August's trading range between $4.49 1/4 and $3.86 3/4 its major (long-term) trend should be considered sideways. Initial resistance is at the 4-month high of $4.29 3/4 (November 2016).
To track my thoughts on the markets throughout the day, follow me on Twitter: www.twitter.com\DarinNewsom

Comments
To comment, please Log In or Join our Community .