

Technically Speaking
Monthly Analysis: Livestock Markets
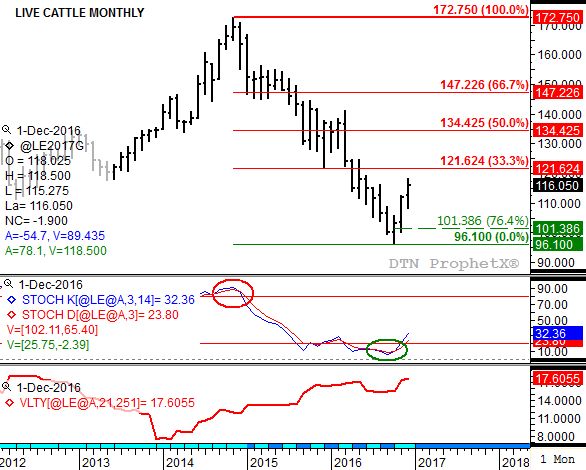
Live Cattle: The February contract closed at $116.05, up $4.10 on the monthly chart. The market remains in a major (long-term) 5-Wave uptrend. Wave 1 could culminate in a test of initial resistance near $121.625, though weekly stochastics indicate the Feb contract has already moved into an overbought situation. This could lead to the establishment of a secondary (intermediate-term) downtrend, or Wave 2 of the major uptrend. Recall that a normal Wave 2 tends to retrace most of Wave 1. Support at the 76.4% retracement level is pegged, for now, near $101.40.
P[L1] D[0x0] M[300x250] OOP[F] ADUNIT[] T[]
Feeder Cattle: The March contract closed at $125.10, down $3.325 on the monthly chart. Despite the lower monthly close the market remains in a major (long-term) 5-Wave uptrend. However, Wave 1 may have been short-lived with Wave 2 set to retrace most the way back to the long-term low of $114.65 (October 2016). Monthly stochastics are bullish and still below the oversold level of 20%.
Lean Hogs: The February contract closed at $66.15, up $10.925 on the monthly chart. Lean hogs remain in a major (long-term) 5-Wave uptrend. Next resistance is pegged near $71.575, a price that marks the 33% retracement level of the previous major 3-Wave downtrend from $133.425 (March 2014) through the low of $40.70 (October 2016).
Corn (Cash): The DTN National Corn Index (NCI.X, national average cash price) closed at $3.15 1/4, up 13 3/4 cents for the month. The move to a new monthly low close of $2.83 3/4 continues to indicate the major (long-term) trend is down, with the subsequent rally tied to the market's ongoing secondary (intermediate-term) uptrend. That being the case the NCI.X could test resistance between $3.17 1/2 and $3.23 1/2 before turning lower again.
Soybean meal: The March contract closed at $316.60, down $1.70 on the continuous monthly chart. Despite the ongoing consolidation pattern the market remains in a major (long-term) 5-Wave uptrend. The September low of $294.10 continues to look like a Wave 2 bottom, retracing 80% of Wave 1 from the low of $258.90 (February 2016) through the high of $432.50 (June 2016).
To track my thoughts on the markets throughout the day, follow me on Twitter: www.twitter.com\DarinNewsom


Comments
To comment, please Log In or Join our Community .