
Technically Speaking
Monthly Analysis: Grain Markets
Corn (Cash): The DTN National Corn Index (NCI.X, national average cash price) closed at $3.26 1/4, down 43 cents for the month. The NCI.X fell right back into its major (long-term) sideways trend in June with resistance still at $4.10 and support near $3.23. Last month's sell-off created a bearish outside range on the monthly chart and saw the NCI.X settle near major support.
Corn (Futures): The more active December contract closed at $3.71 1/4, down 33 1/2 cents on the monthly chart. The sharp sell-off in June pulled the market back into its previous major (long-term) sideways trend with resistance at $4.43 1/2 continuing to hold. Initial support is near $3.50 1/4, then the major low of $3.18 1/4 (October 2014).
P[L1] D[0x0] M[300x250] OOP[F] ADUNIT[] T[]
Soybeans (Cash): The DTN National Soybean Index (NSI.X, national average cash price) closed at $11.12, up $1.01 1/4 for the month. The major (long-term) uptrend continues to strengthen. The NSI.X was testing resistance at $11.18 3/4, a price that marks the 33% retracement level of the previous major downtrend from $17.47 3/4 (August 2012) through the low near $8.05 (March 2016). The 38.2% retracement level is up at $11.65.
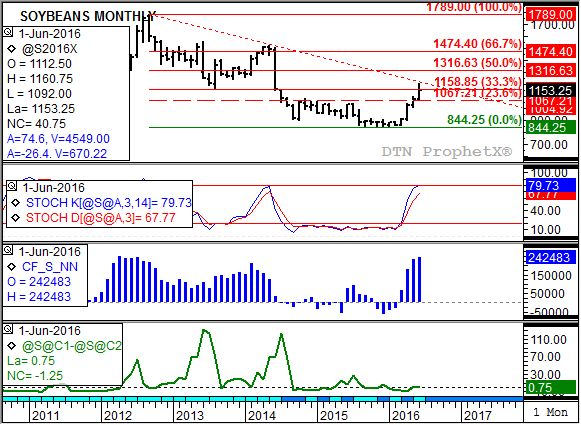
Soybeans (Futures): The more active November contract closed at $11.53 1/4, up 74 3/4 cents on the monthly chart. The major (long-term) trend remains. The market was testing resistance near $11.58 3/4 late in the month, a price that marks the 33% retracement level of the previous downtrend from $17.89 (September 2012) through the low of $8.44 1/4 (November 2015). Trendline resistance is pegged near $12.08 3/4 in July.
Wheat (Cash): The DTN National SRW Wheat Index (SR.X, national average cash price) closed at $4.11 1/2, down 13 1/4 cents for the month. The major (long-term) trend is sideways with support at the February 2016 low near $4.02 1/4.
SRW Wheat (Futures): The September Chicago contract closed at $4.45 1/2, down 19 cents on the monthly chart. The major (long-term) trend is sideways-to-down as the September fell below the March 2016 low of $4.42 1/4.
To track my thoughts on the markets throughout the day, follow me on Twitter: www.twitter.com\DarinNewsom

Comments
To comment, please Log In or Join our Community .